
FILSPARI® (sparsentan)
DUPLEX (Phase 3 Study): Study Design & Results
DUPLEX overview
DUPLEX was a large, global, randomized, multicenter, double-blind, active-controlled, Phase 3 FSGS study 1, 2
Objective: To evaluate potential long-term nephroprotective effects and safety of sparsentan in pediatric and adult patients with biopsy-proven FSGS or documented genetic mutation in podocyte protein associated with FSGS compared to maximum-labeled dose irbesartan, an ARB 1, 2
DUPLEX overview
Endpoints:
Primary:Total eGFR slope (Change from Day 1 to Week 108) 3
Secondary 3 :
- Change in eGFR from Week 6 to Week 108
- Change in eGFR from baseline to 4 weeks postcessation of randomized treatment at week 112
Safety outcomes 3

Clinical significance:
Safety and efficacy findings from the DUPLEX study support the regulatory approval of sparsentan, the first FDA-approved medicine to reduce proteinuria in adult and pediatric patients aged 8 years and older with FSGS who do not have nephrotic syndrome 3 - 5*
Key findings:
Compared to those in the maximum-labeled dose irbesartan group (n=187), patients in the sparsentan group
(n=184) experienced
3
:

Greater reduction in proteinuria at Week 36 with sustained reduction over 108 weeks3

Earlier and more frequent low proteinuria thresholds, including complete remission of proteinuria (UPCR <0.3 g/g)3

A comparable safety profile, with the frequency of AEs similar between the two groups3

Irrespective of treatment 6 :
Patients who achieved UPCR <0.7 g/g at any time on treatment over 108 weeks were less likely to reach kidney failure vs. those who did not6

Footnotes:
*Nephrotic syndrome includes the presence of three concurrent criteria: proteinuria greater than 3.5 g/24h (adults) or UPCR >2.0 g/g (pediatric patients <18 years of age), serum albumin <3.0 g/dL, and edema. 4
Baseline characteristics
The overall FSGS patient population was geographically broad and clinically diverse 2

Median age 2
42 years

Sex 2
54% male
46% female

Race 2
73% White
13% Asian
7% Black/African American
7% Other race

Proteinuria 2
3.0 g/g median UPCR
Nephrotic syndrome 4
32% of patients

Mean eGFR 2†
64 ± 30 mL/min/1.73 m2

History of hypertension 2
64% of patients

Edema 2
38% of patients
Footnotes:
*Nephrotic syndrome includes documentation of nephrotic syndrome in the medical history or the presence of three concurrent criteria: proteinuria greater than 3.5 g/24h (adults) or UPCR >2.0 g/g (pediatric patients <18 years of age), serum albumin <3.0 g/dL, and edema. 3, 4 †eGFR was determined using the CKD-EPI equation for patients ≥16 years of age at screening, and the modified Schwartz formula for patients <16 years of age at screening. 2
Overall population demographics and baseline characteristics 3
Data are given as n (%) or median (IQR) unless otherwise noted. Plus–minus values are means ± SD.

Footnotes:
Pediatric subgroup demographics and baseline characteristics 8
Data are given as n (%) or median (IQR) unless otherwise noted.

Footnotes:
Genetic-associated FSGS subgroup demographics and baseline characteristics 9
Data are given as n (%), median (IQR), or mean (SD) unless otherwise noted.

Footnotes:
Efficacy
Interactive Figures
Please select and start exploring
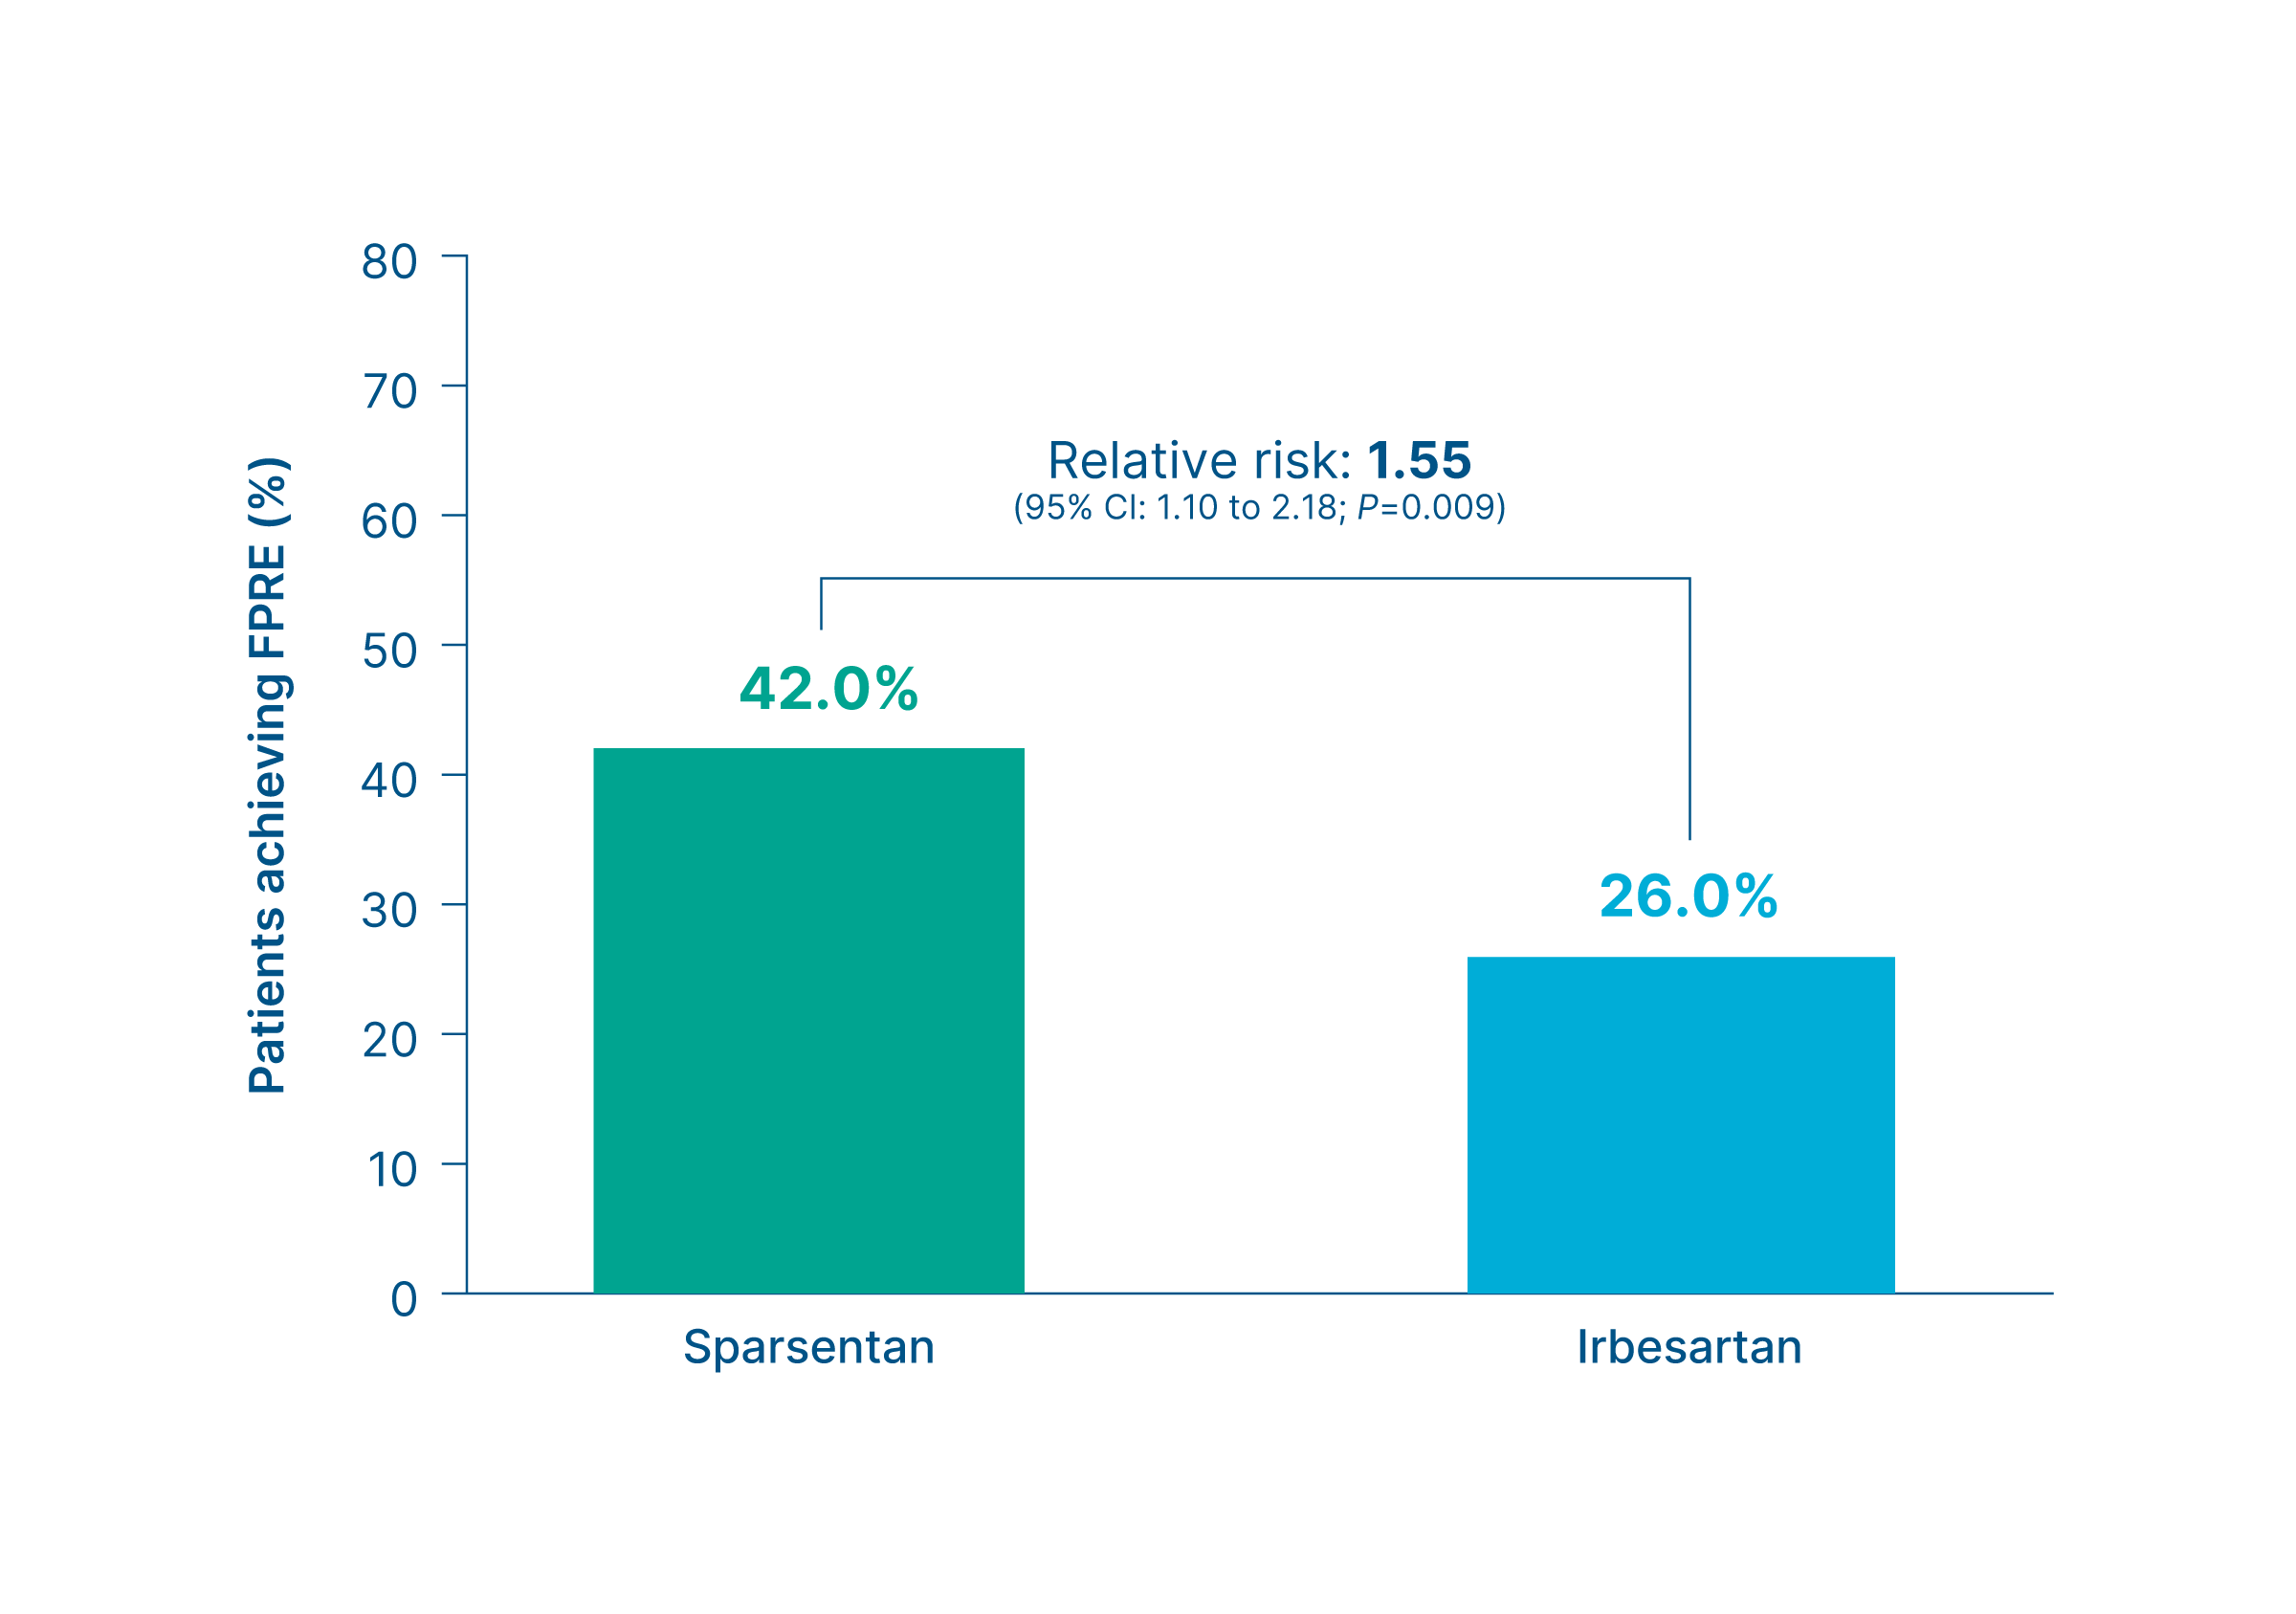
FSGS partial remission endpoint at Week 36
Surrogate efficacy endpoint
Proportion of patients who achieved FSGS partial remission endpoint
(UPCR ≤1.5 g/g and >40% reduction from baseline) at Week 36
3*
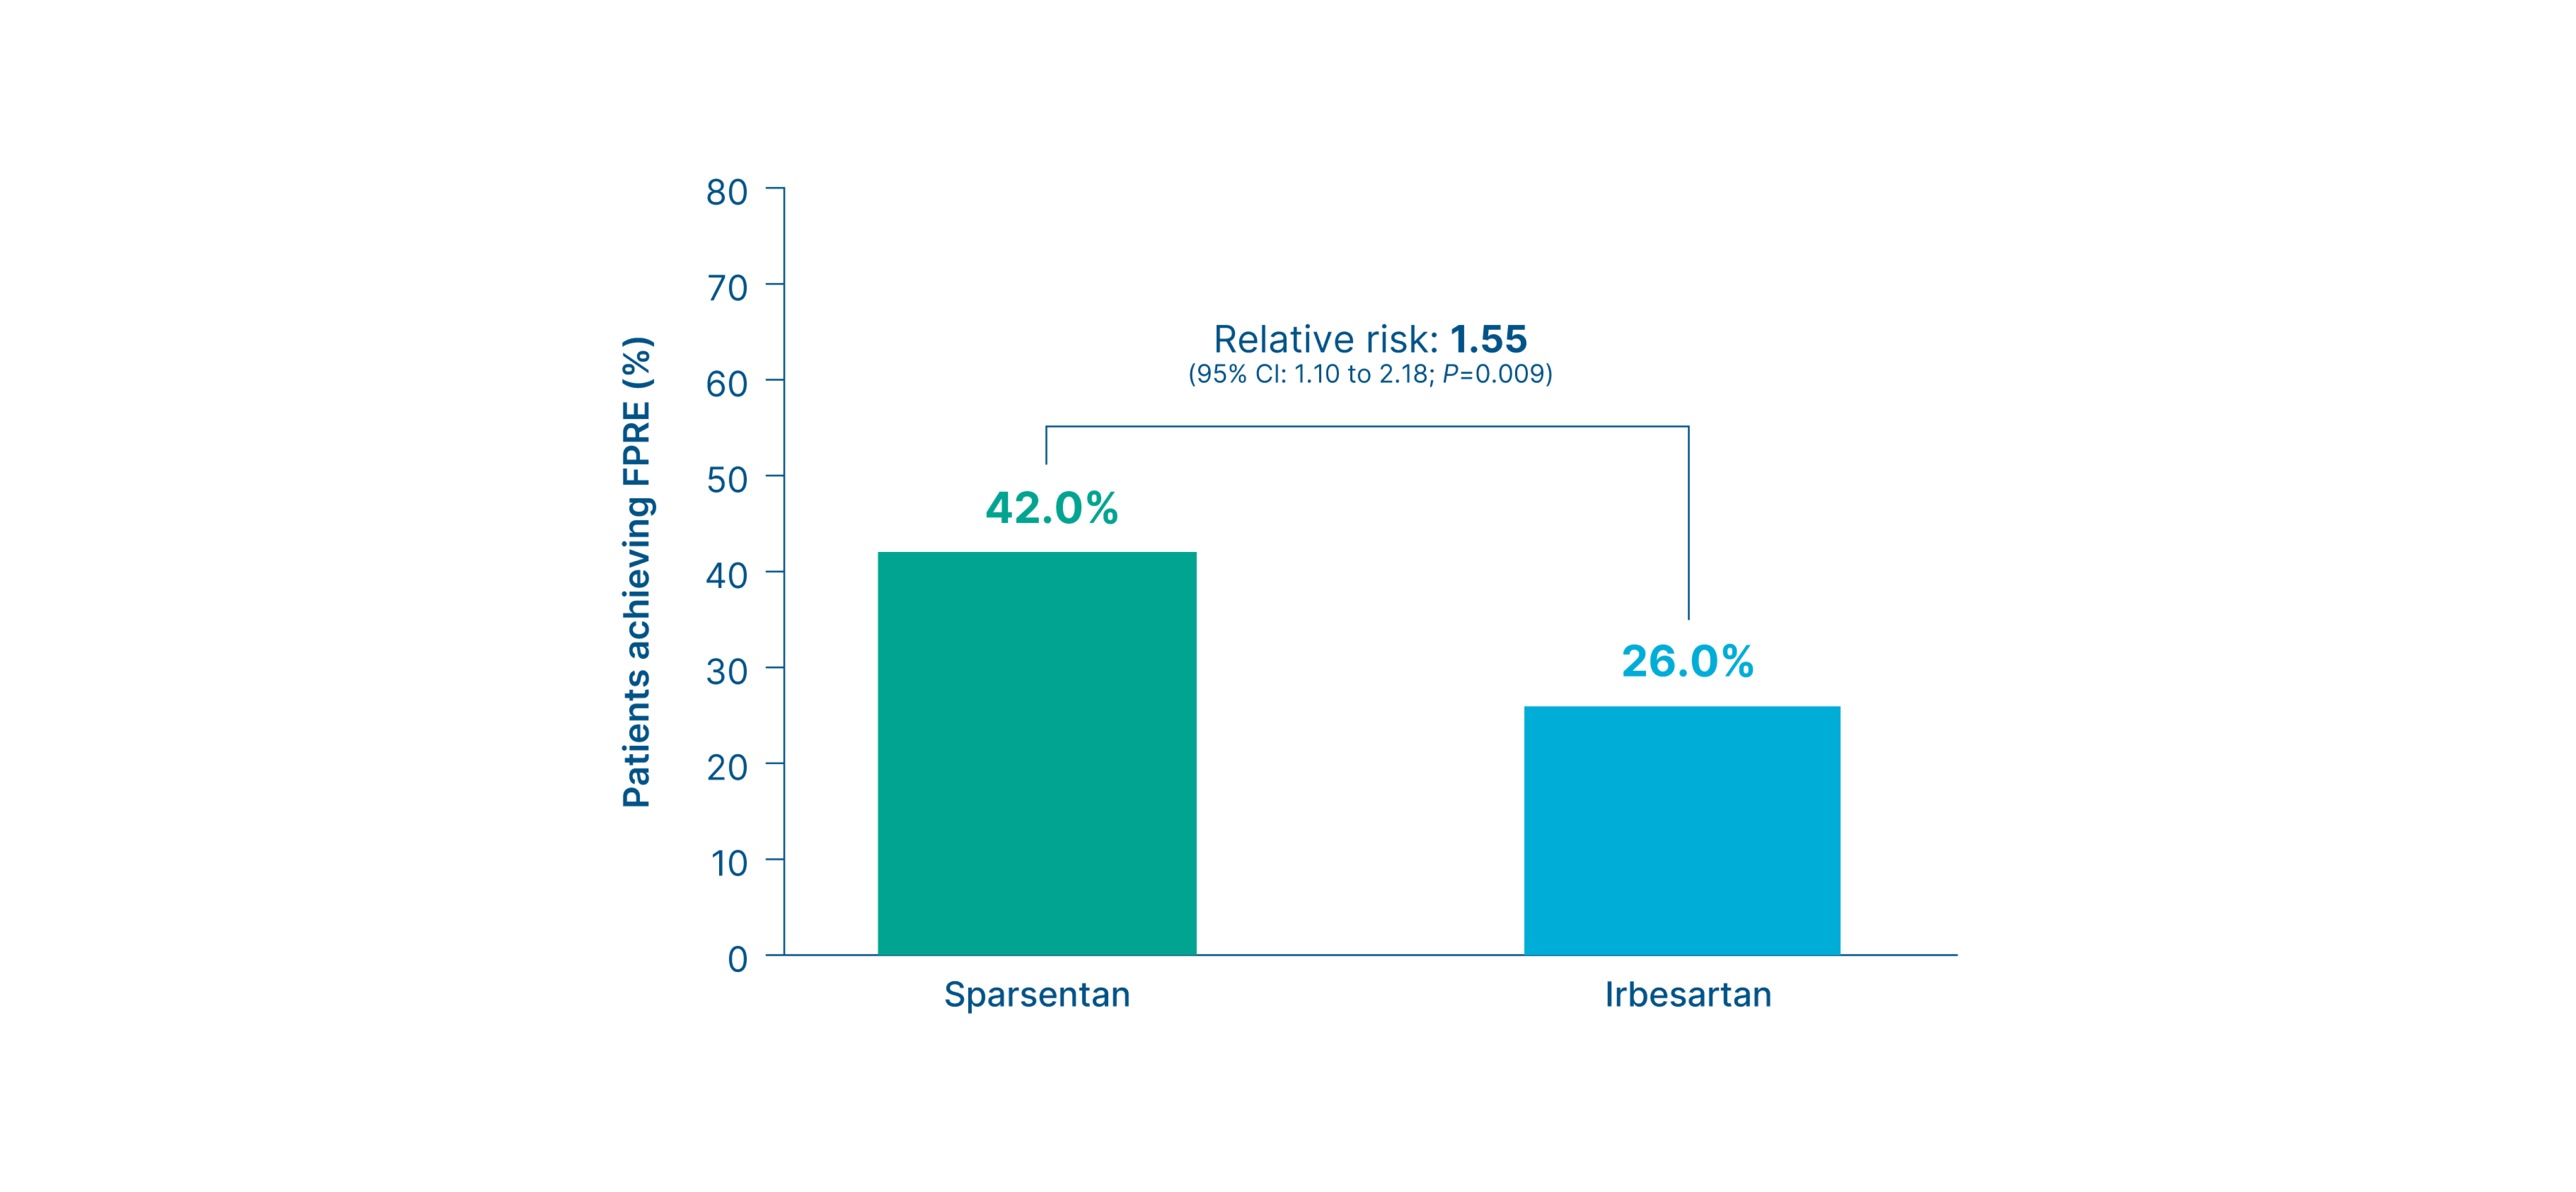
Summary
- Significantly more patients in the sparsentan group achieved FPRE by Week 36 than those in the irbesartan group (42% vs. 26%, Difference: 16%, 95% CI: 4.0 to 28.0) 3
- Findings were sustained through Week 108 3
Footnotes
*The estimated percentages that are shown were derived from an analysis that used a generalized linear model with multiple imputation. The observed number of patients who had partial remission was 39/88 (44.3%) in the sparsentan group and 19/82 (23.2%) in the irbesartan group. 3
FSGS partial remission endpoint at Week 108
Prespecified exploratory endpoint
Proportion of patients who achieved FSGS partial remission endpoint
(UPCR ≤1.5 g/g and >40% reduction from baseline) at Week 108
3,
10*
Summary
- More patients in the sparsentan group achieved the FPRE by Week 36 and findings were sustained through Week 108 3
- At Week 108, approximately 38% of patients treated with sparsentan and 23% of patients treated with irbesartan achieved the FPRE 3
Footnotes
*The estimated proportions reported in the figure are from a generalized linear model analysis with multiple imputation. The observed number of cases was 51/119 (43%) with sparsentan and 35/128 (27%) with irbesartan. 10
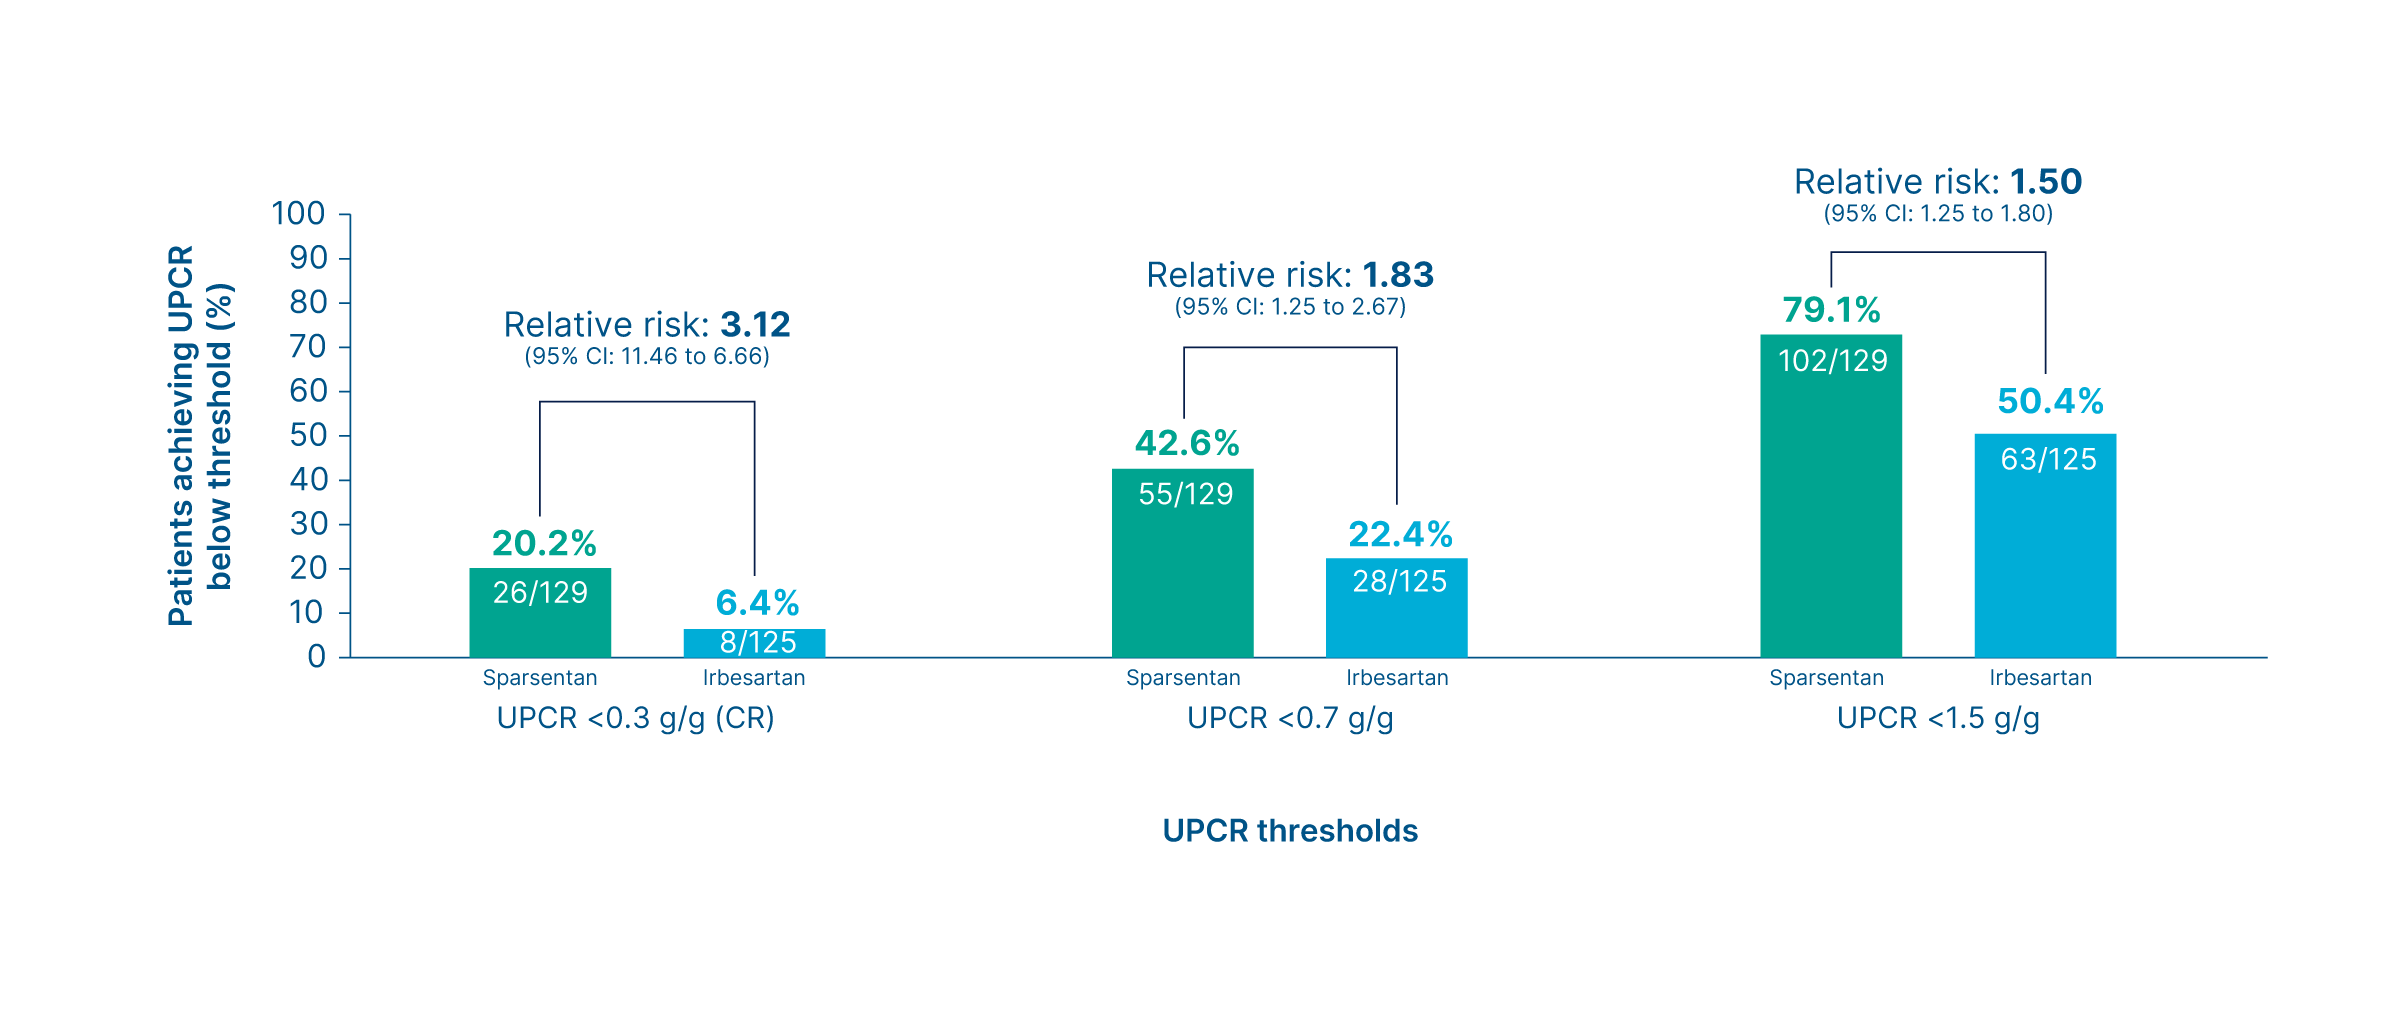
Proteinuria thresholds <0.3, <0.7, and <1.5 g/g
Exploratory and post-hoc endpoints
Proportion of patients who achieved UPCR <0.3, <0.7, and <1.5 g/g 3, 6, 10
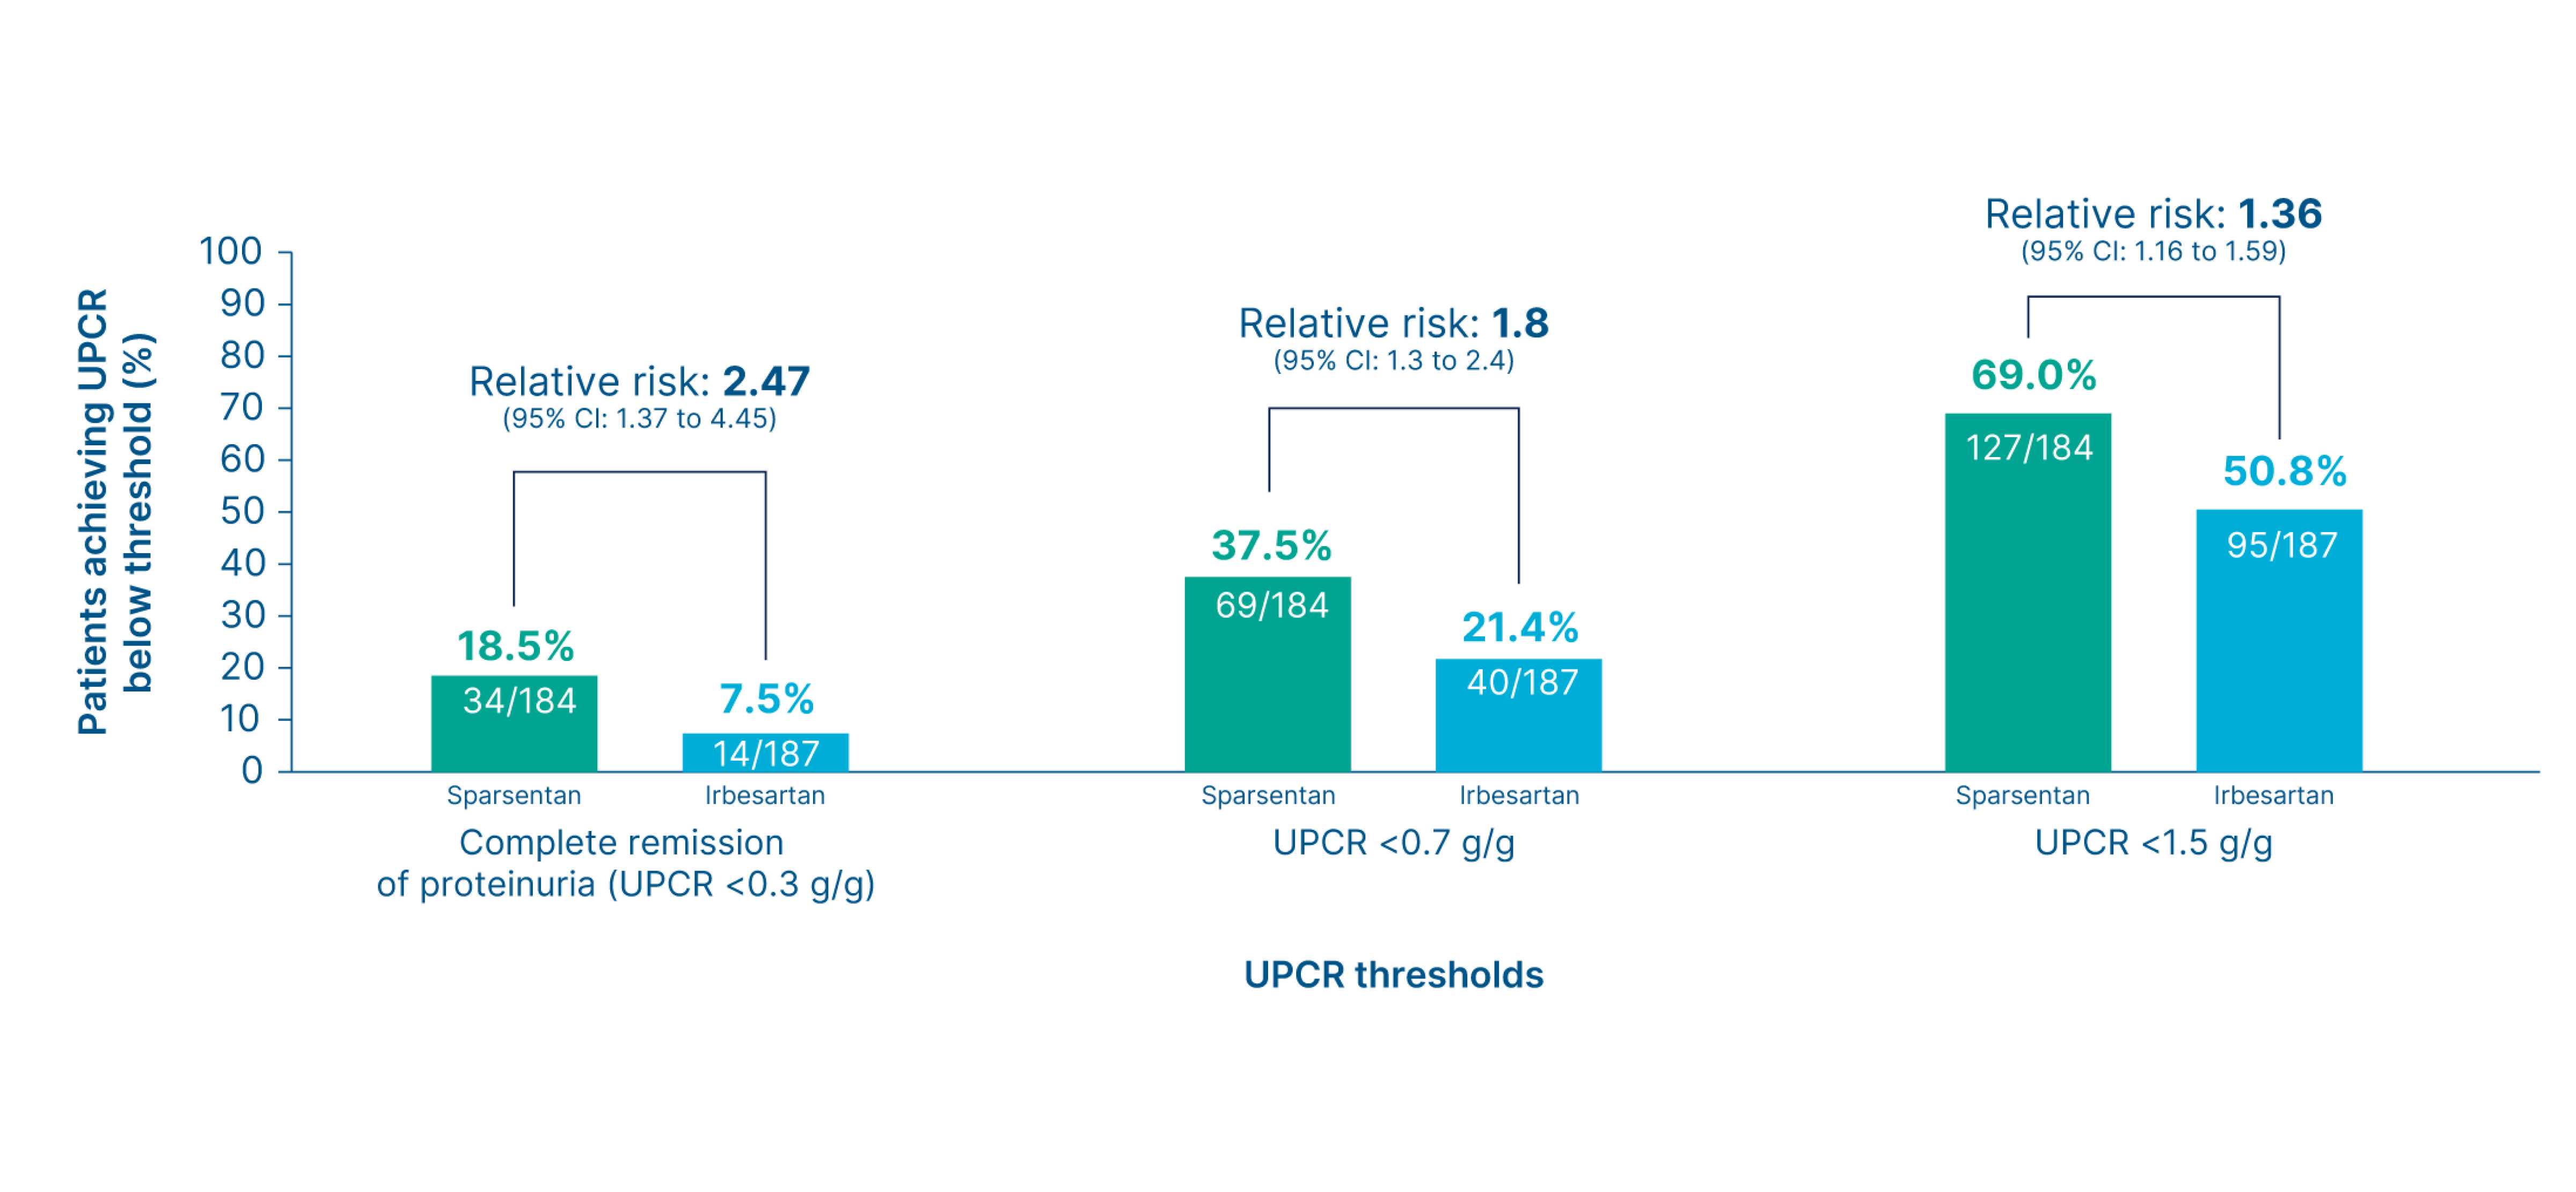
Summary
- More patients in the sparsentan group achieved complete remission of proteinuria (UPCR of <0.3 g/g) and UPCR levels <0.7 g/g and <1.5 g/g compared to the irbesartan group 3, 6
- The treatment effect of sparsentan was consistent across evaluated key proteinuria thresholds (<0.3, <0.7, and <1.5 g/g) 3, 6
Proteinuria (UPCR) at Week 108
Prespecified exploratory endpoint
Change in UPCR from baseline up to Week 108 3
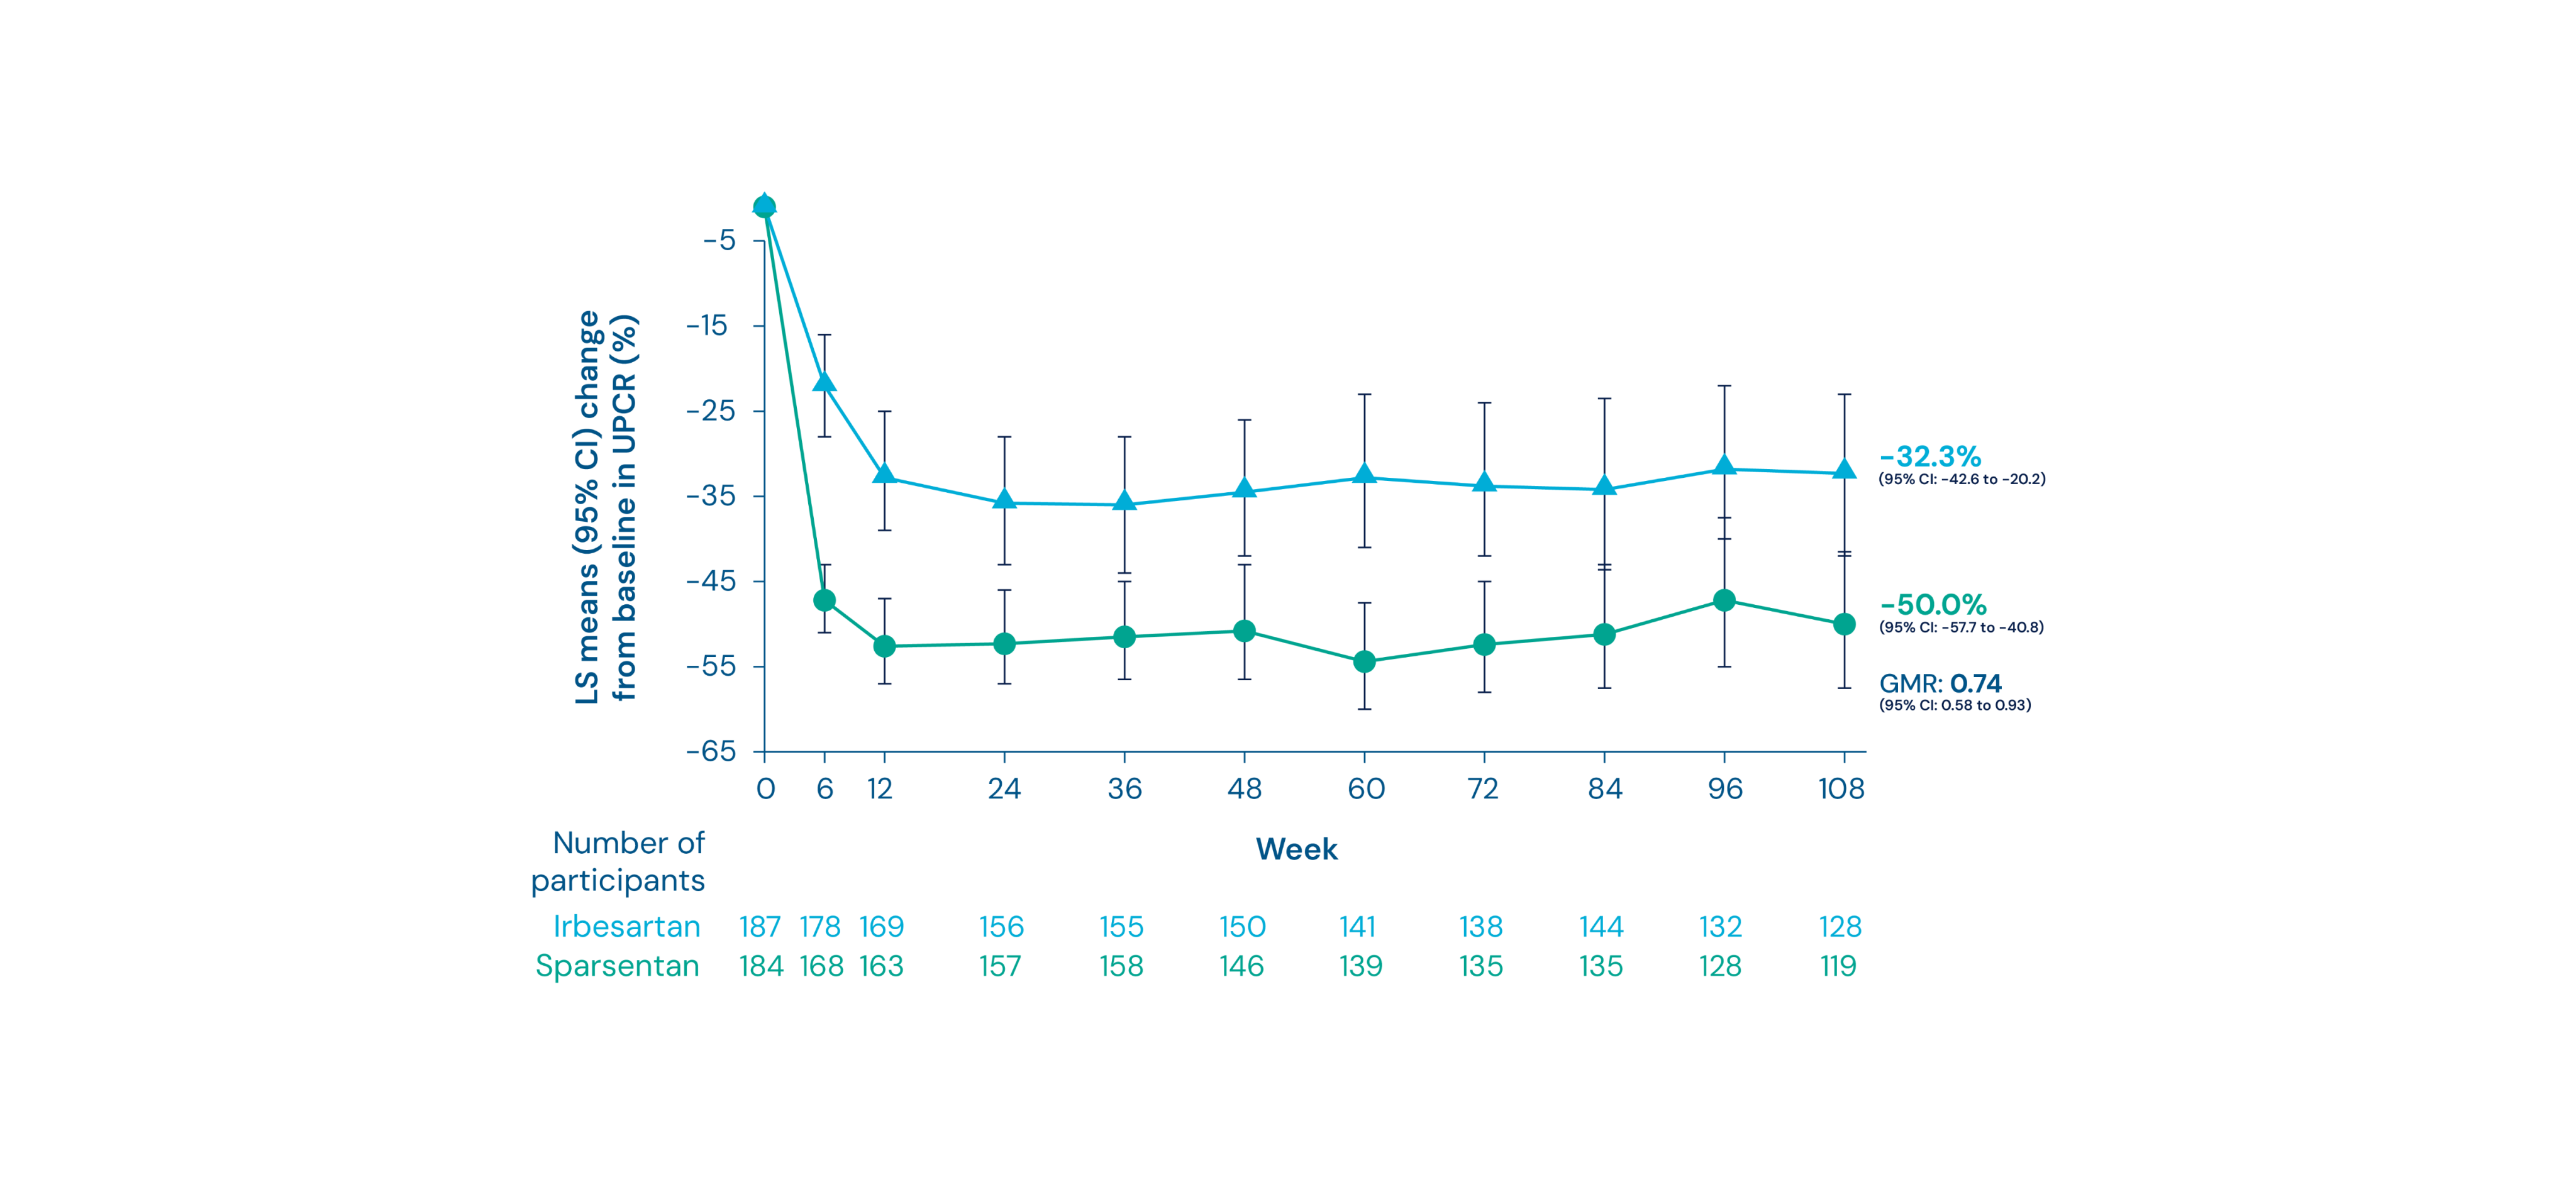
Summary
- Treatment with sparsentan led to greater and sustained reductions in proteinuria compared with irbesartan 3
- At 108 weeks, there was a mean reduction of proteinuria of 50% from baseline in patients receiving sparsentan vs. 32% in those receiving irbesartan 3
- The geometric LS mean ratio was 0.74 (95% CI: 0.58 to 0.93) 3
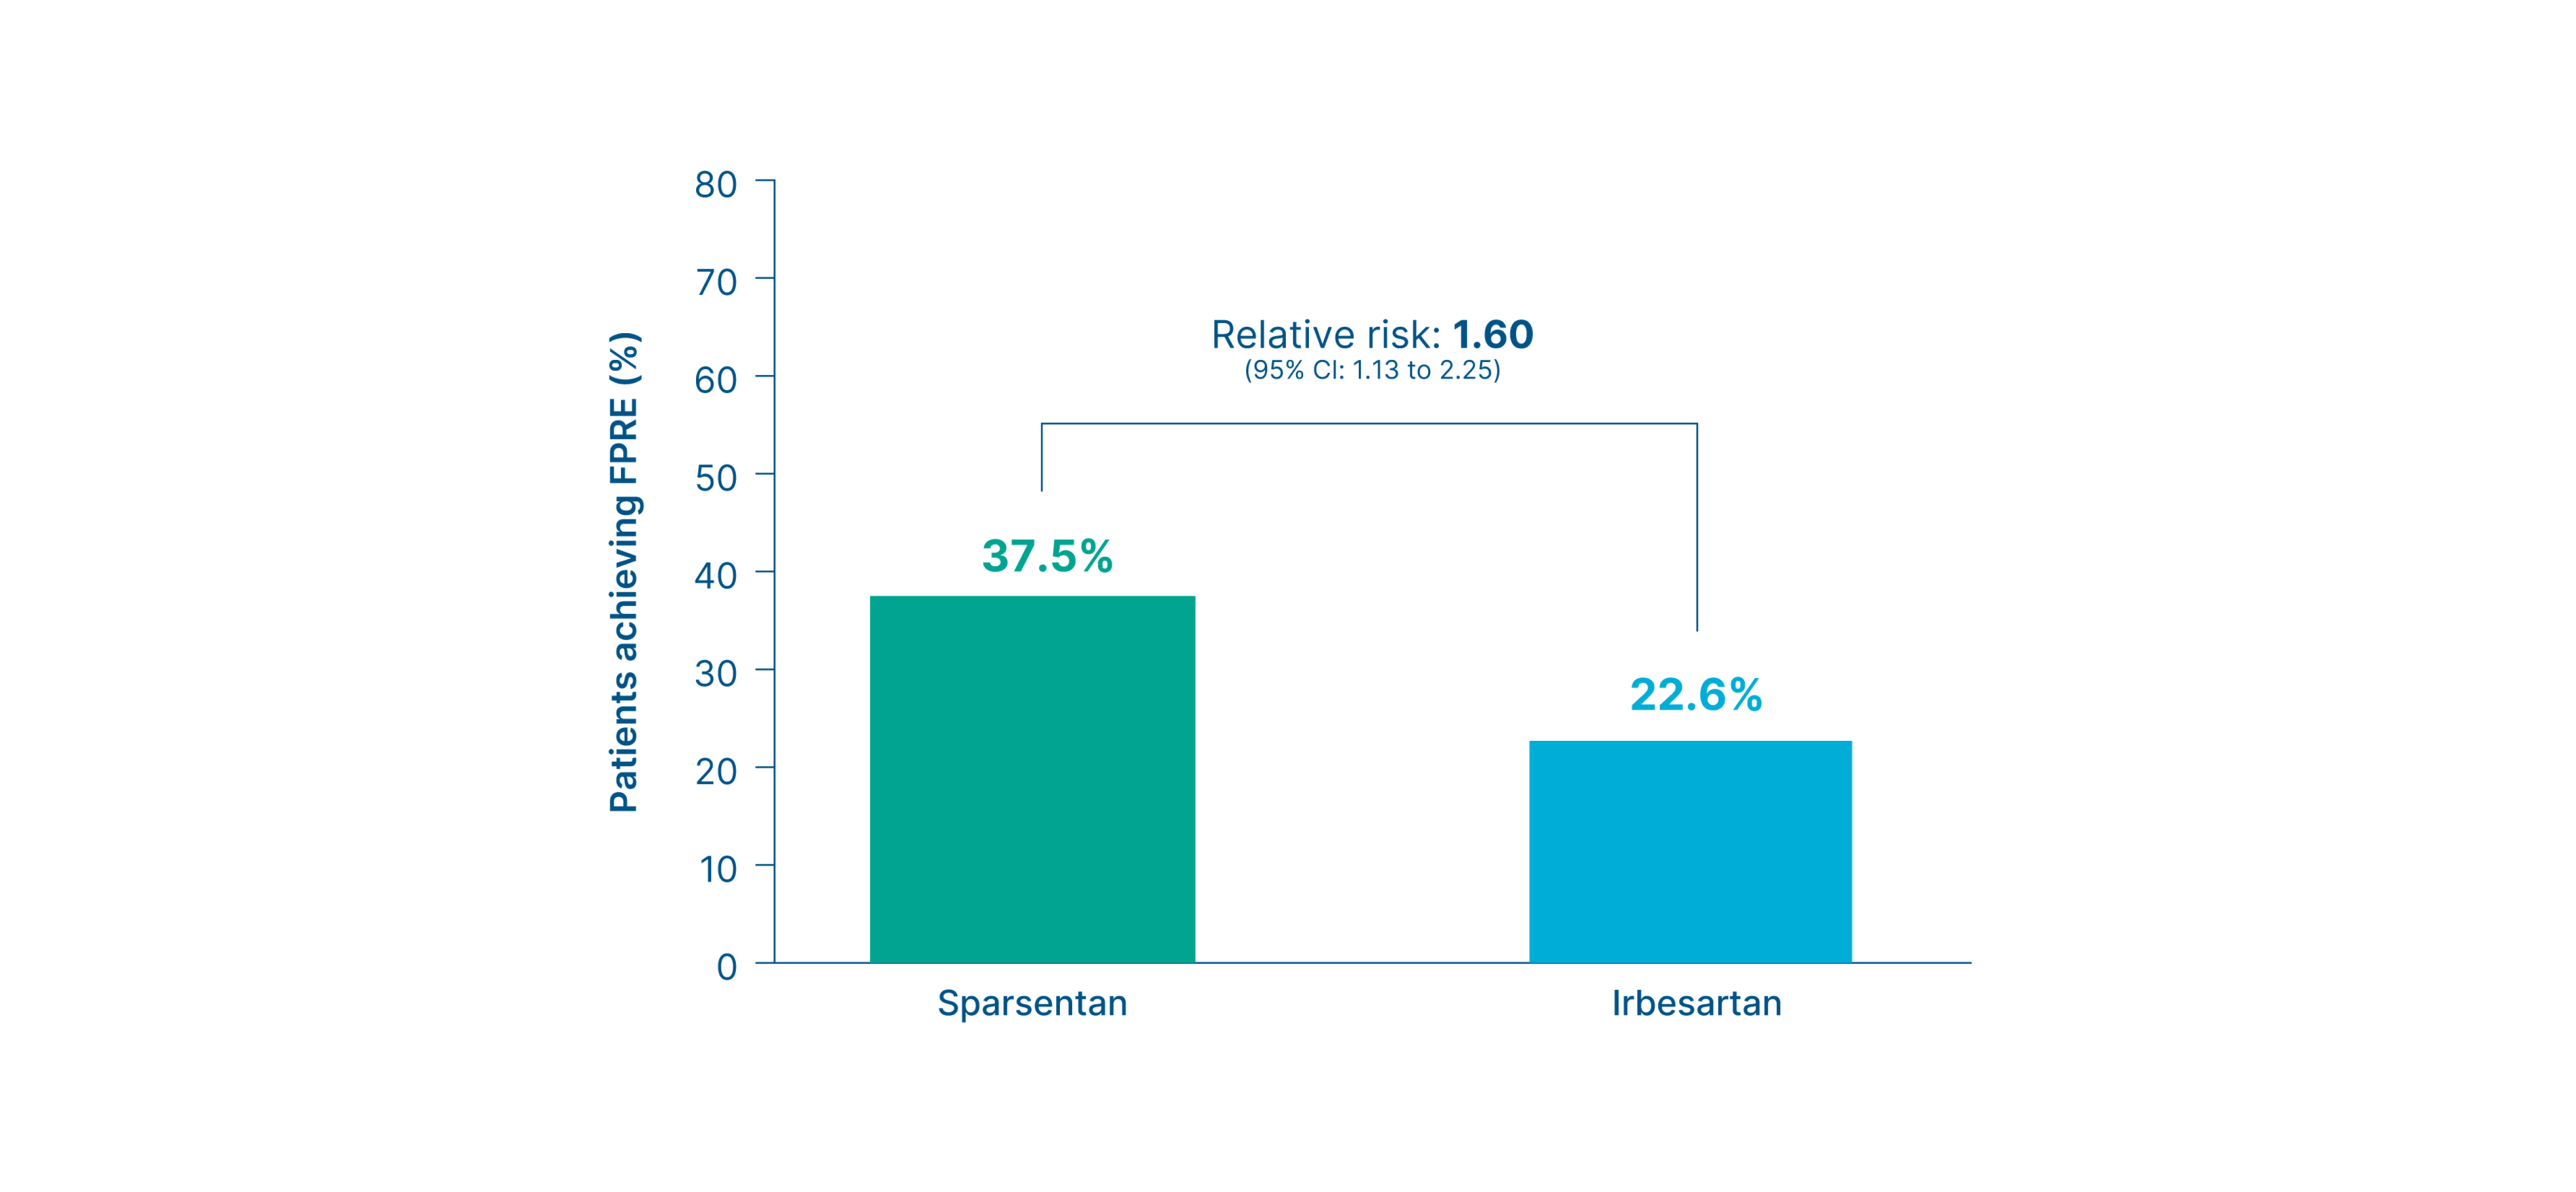
Time to complete remission of proteinuria
Exploratory endpoint
Time to complete remission of proteinuria 10
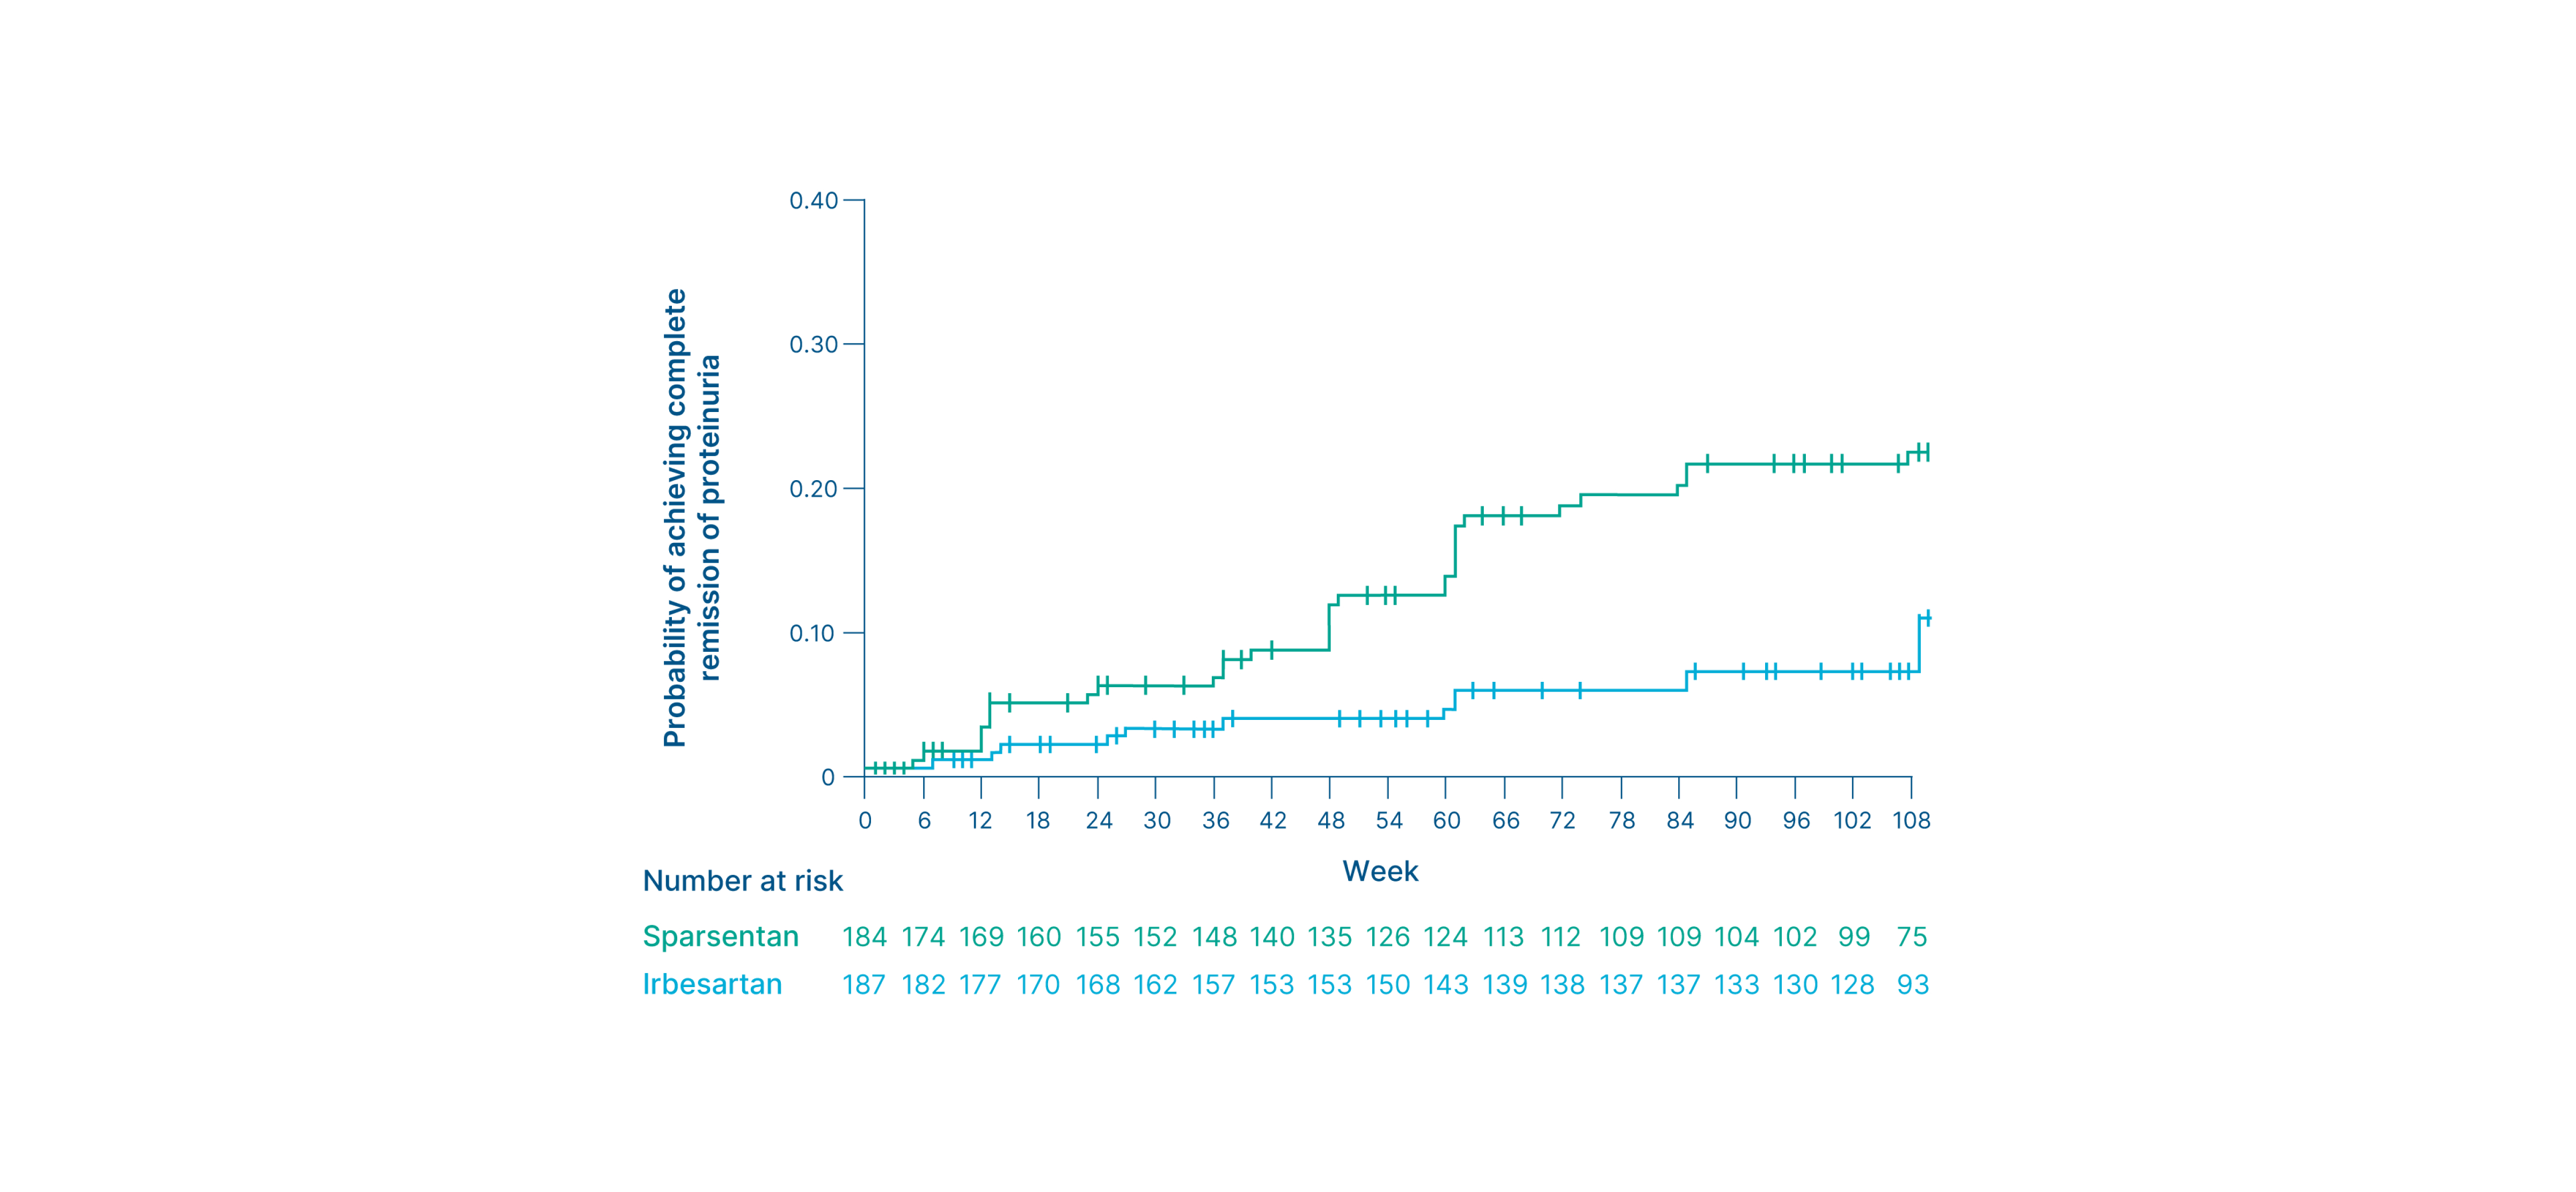
Summary
- Thirty-four (18.5%) patients receiving sparsentan achieved complete remission of proteinuria (UPCR of <0.3 g/g) vs. 14 (7.5%) of those receiving irbesartan 3
- Patients in the sparsentan group achieved complete remission of proteinuria (UPCR of <0.3 g/g) earlier than those in the irbesartan group 3, 10
Time to UPCR <0.7 g/g
Post-hoc exploratory endpoint
Time to UPCR <0.7 g/g 6
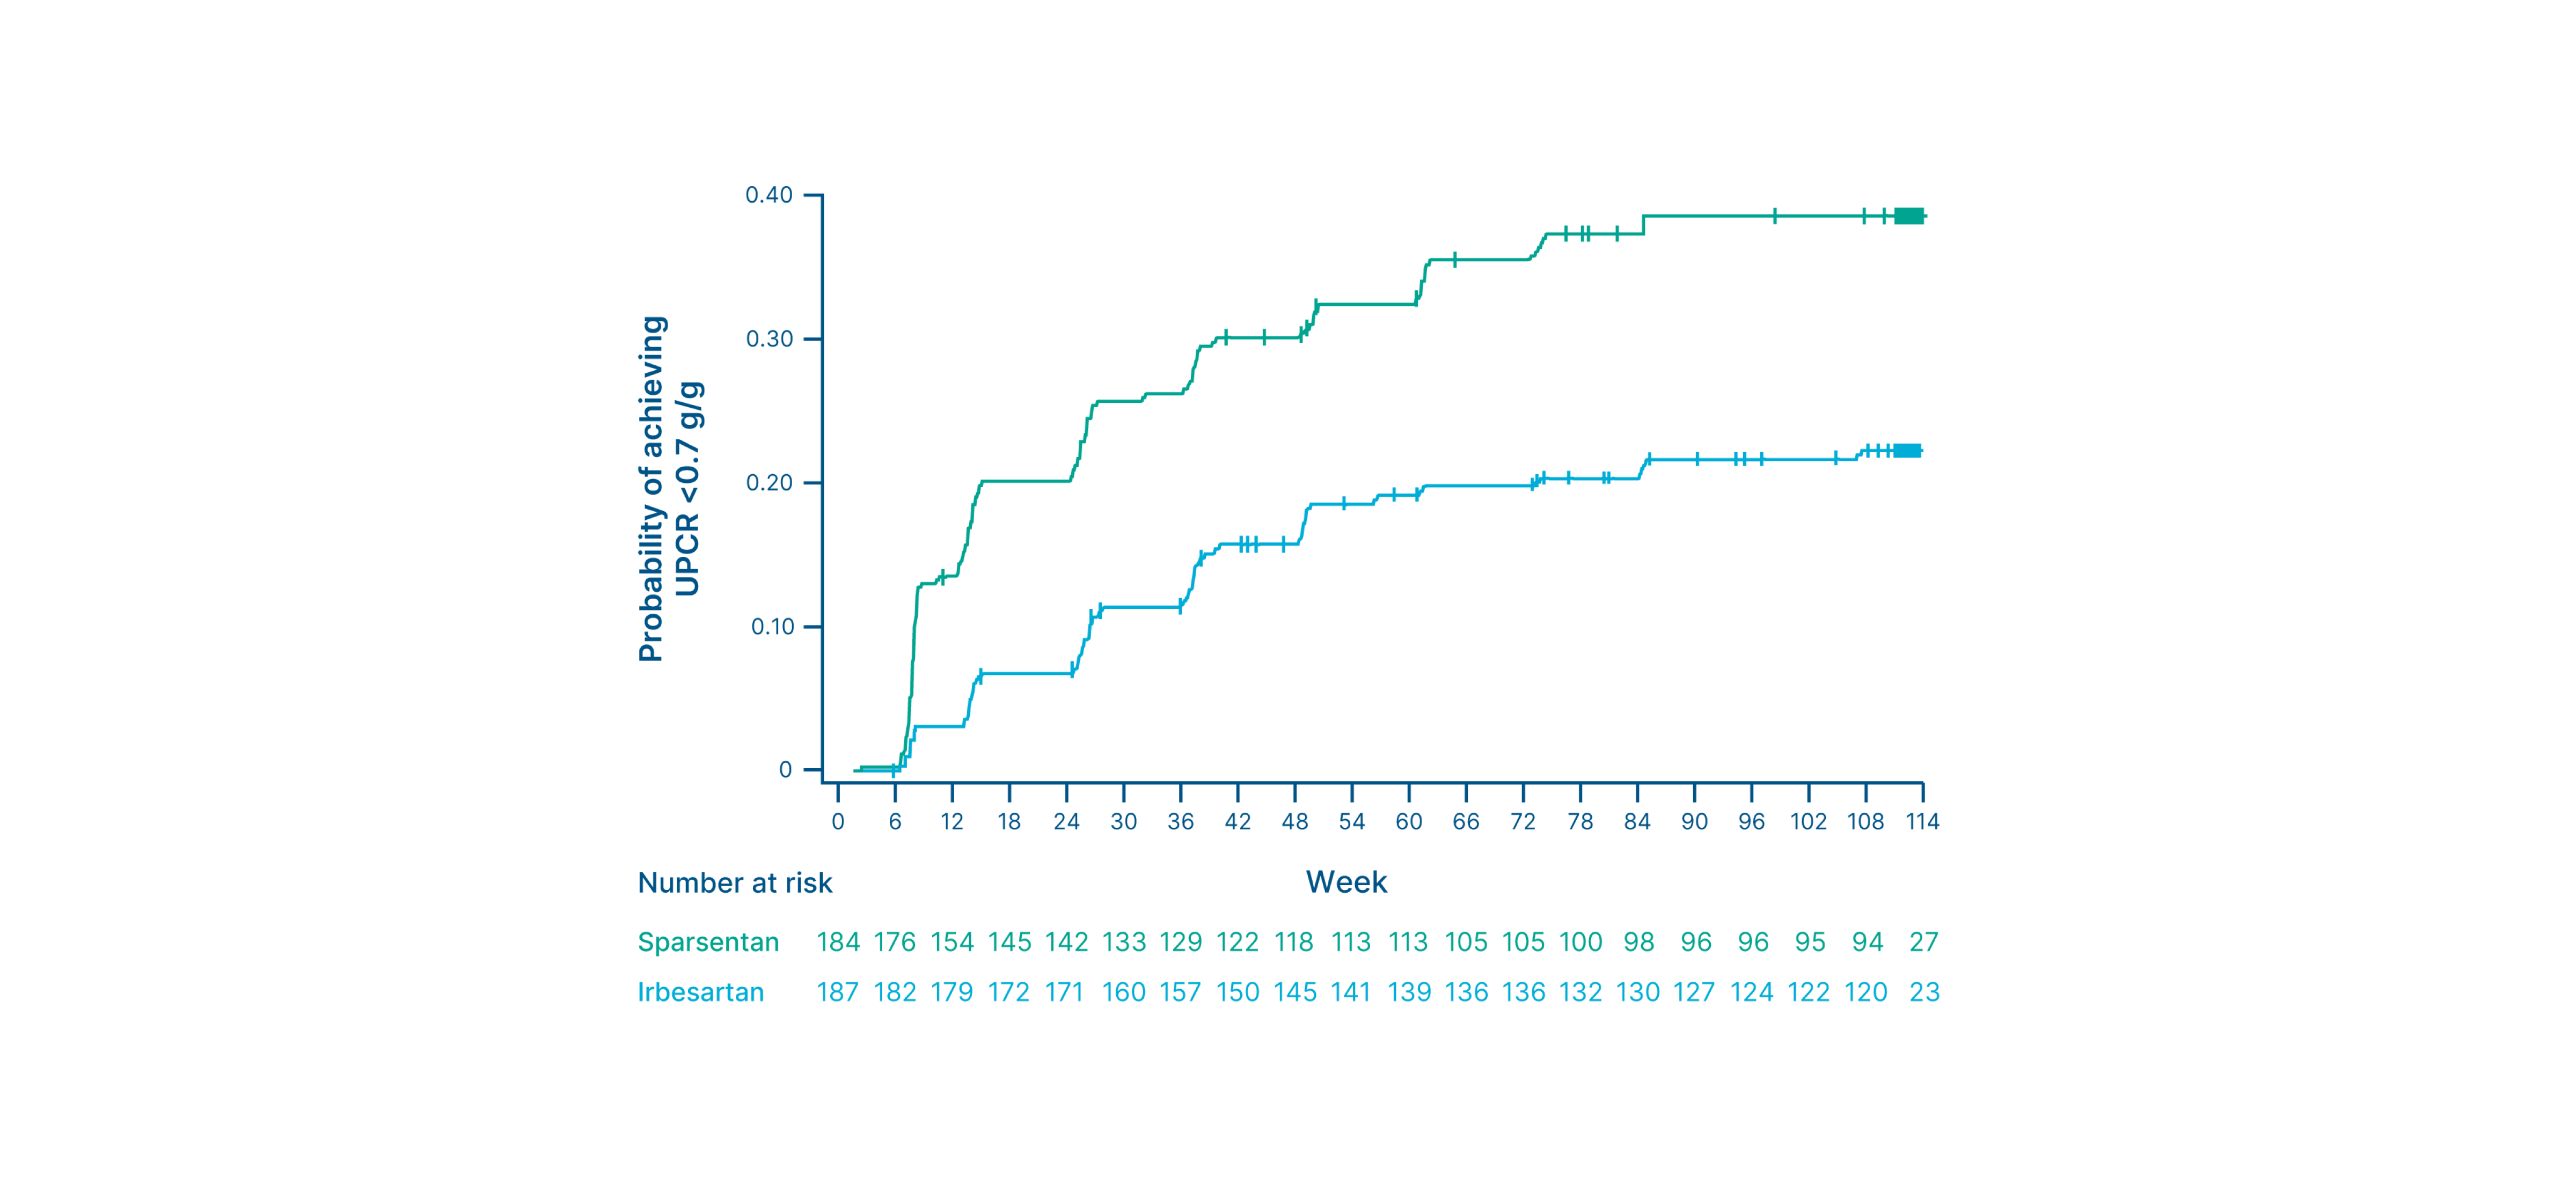
Summary
- Sixty-nine (38%) patients receiving sparsentan achieved UPCR <0.7 g/g compared to 40 (21%) patients receiving irbesartan 6
- Sparsentan was associated with a higher probability of achieving UPCR <0.7 g/g 6
Time to the FSGS partial remission endpoint
Exploratory endpoint
Time to FSGS partial remission endpoint (UPCR ≤1.5 g/g and >40% reduction from baseline) 10
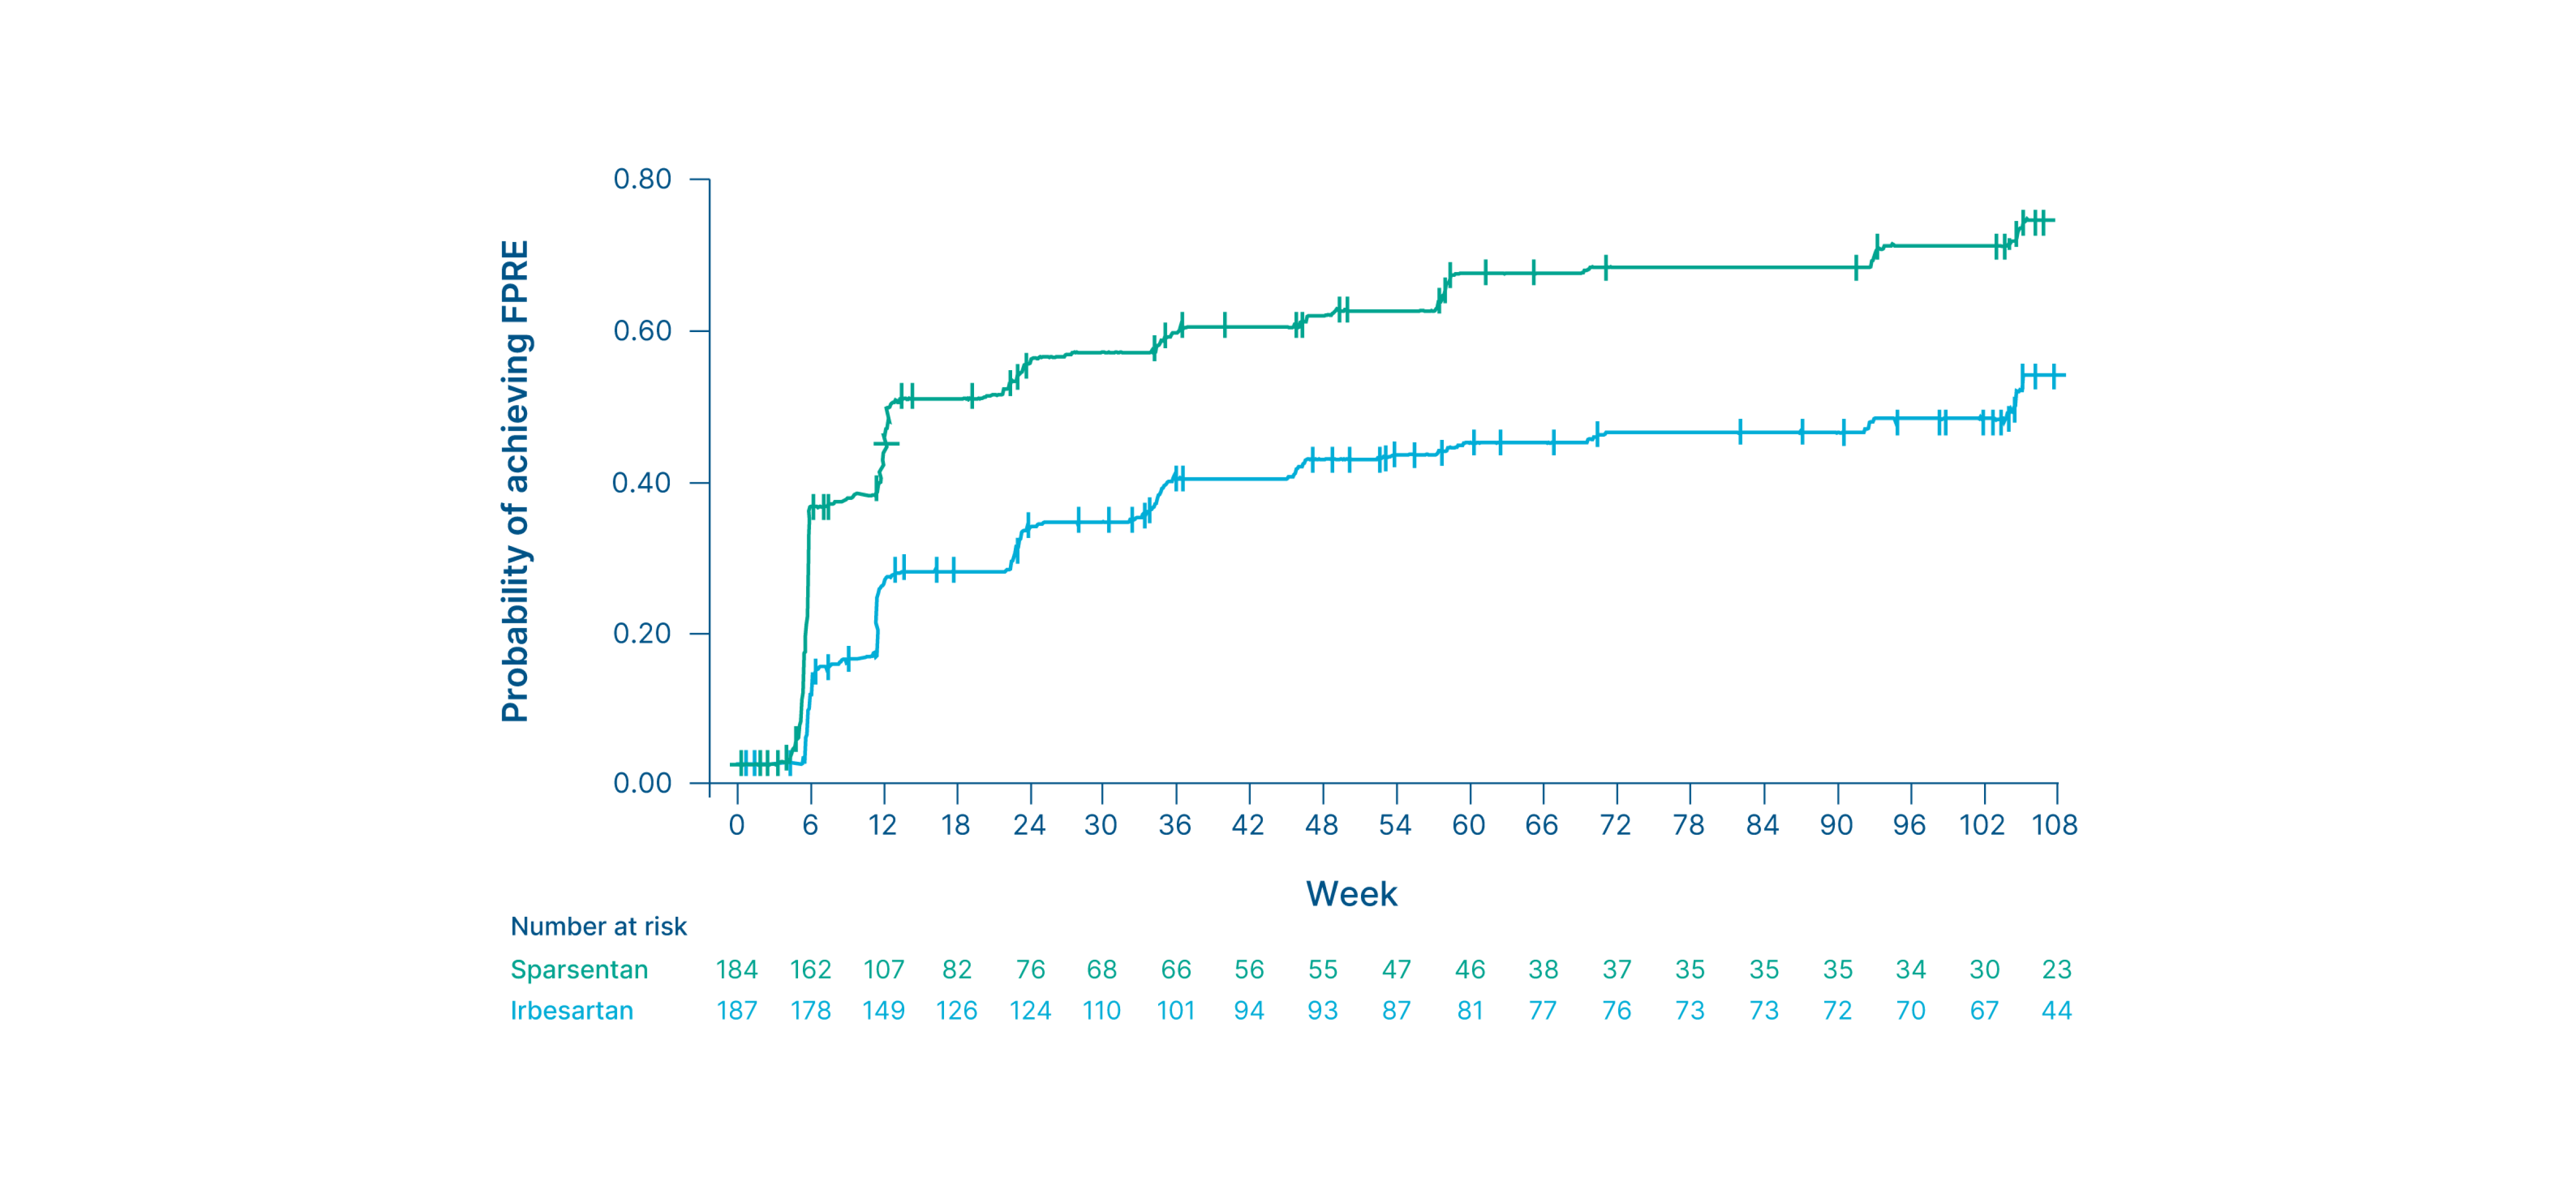
Summary
- Approximately 38% of patients receiving sparsentan achieved the FPRE vs. 23% of those receiving irbesartan 3*
- The median time to response was shorter with sparsentan compared to irbesartan (14.1 vs. 109.0 weeks) 3, 10
Footnotes
*The estimated proportions reported are from a generalized linear model analysis with multiple imputation. The observed number of cases was 51/119 (43%) with sparsentan and 35/128 (27%) with irbesartan. 10
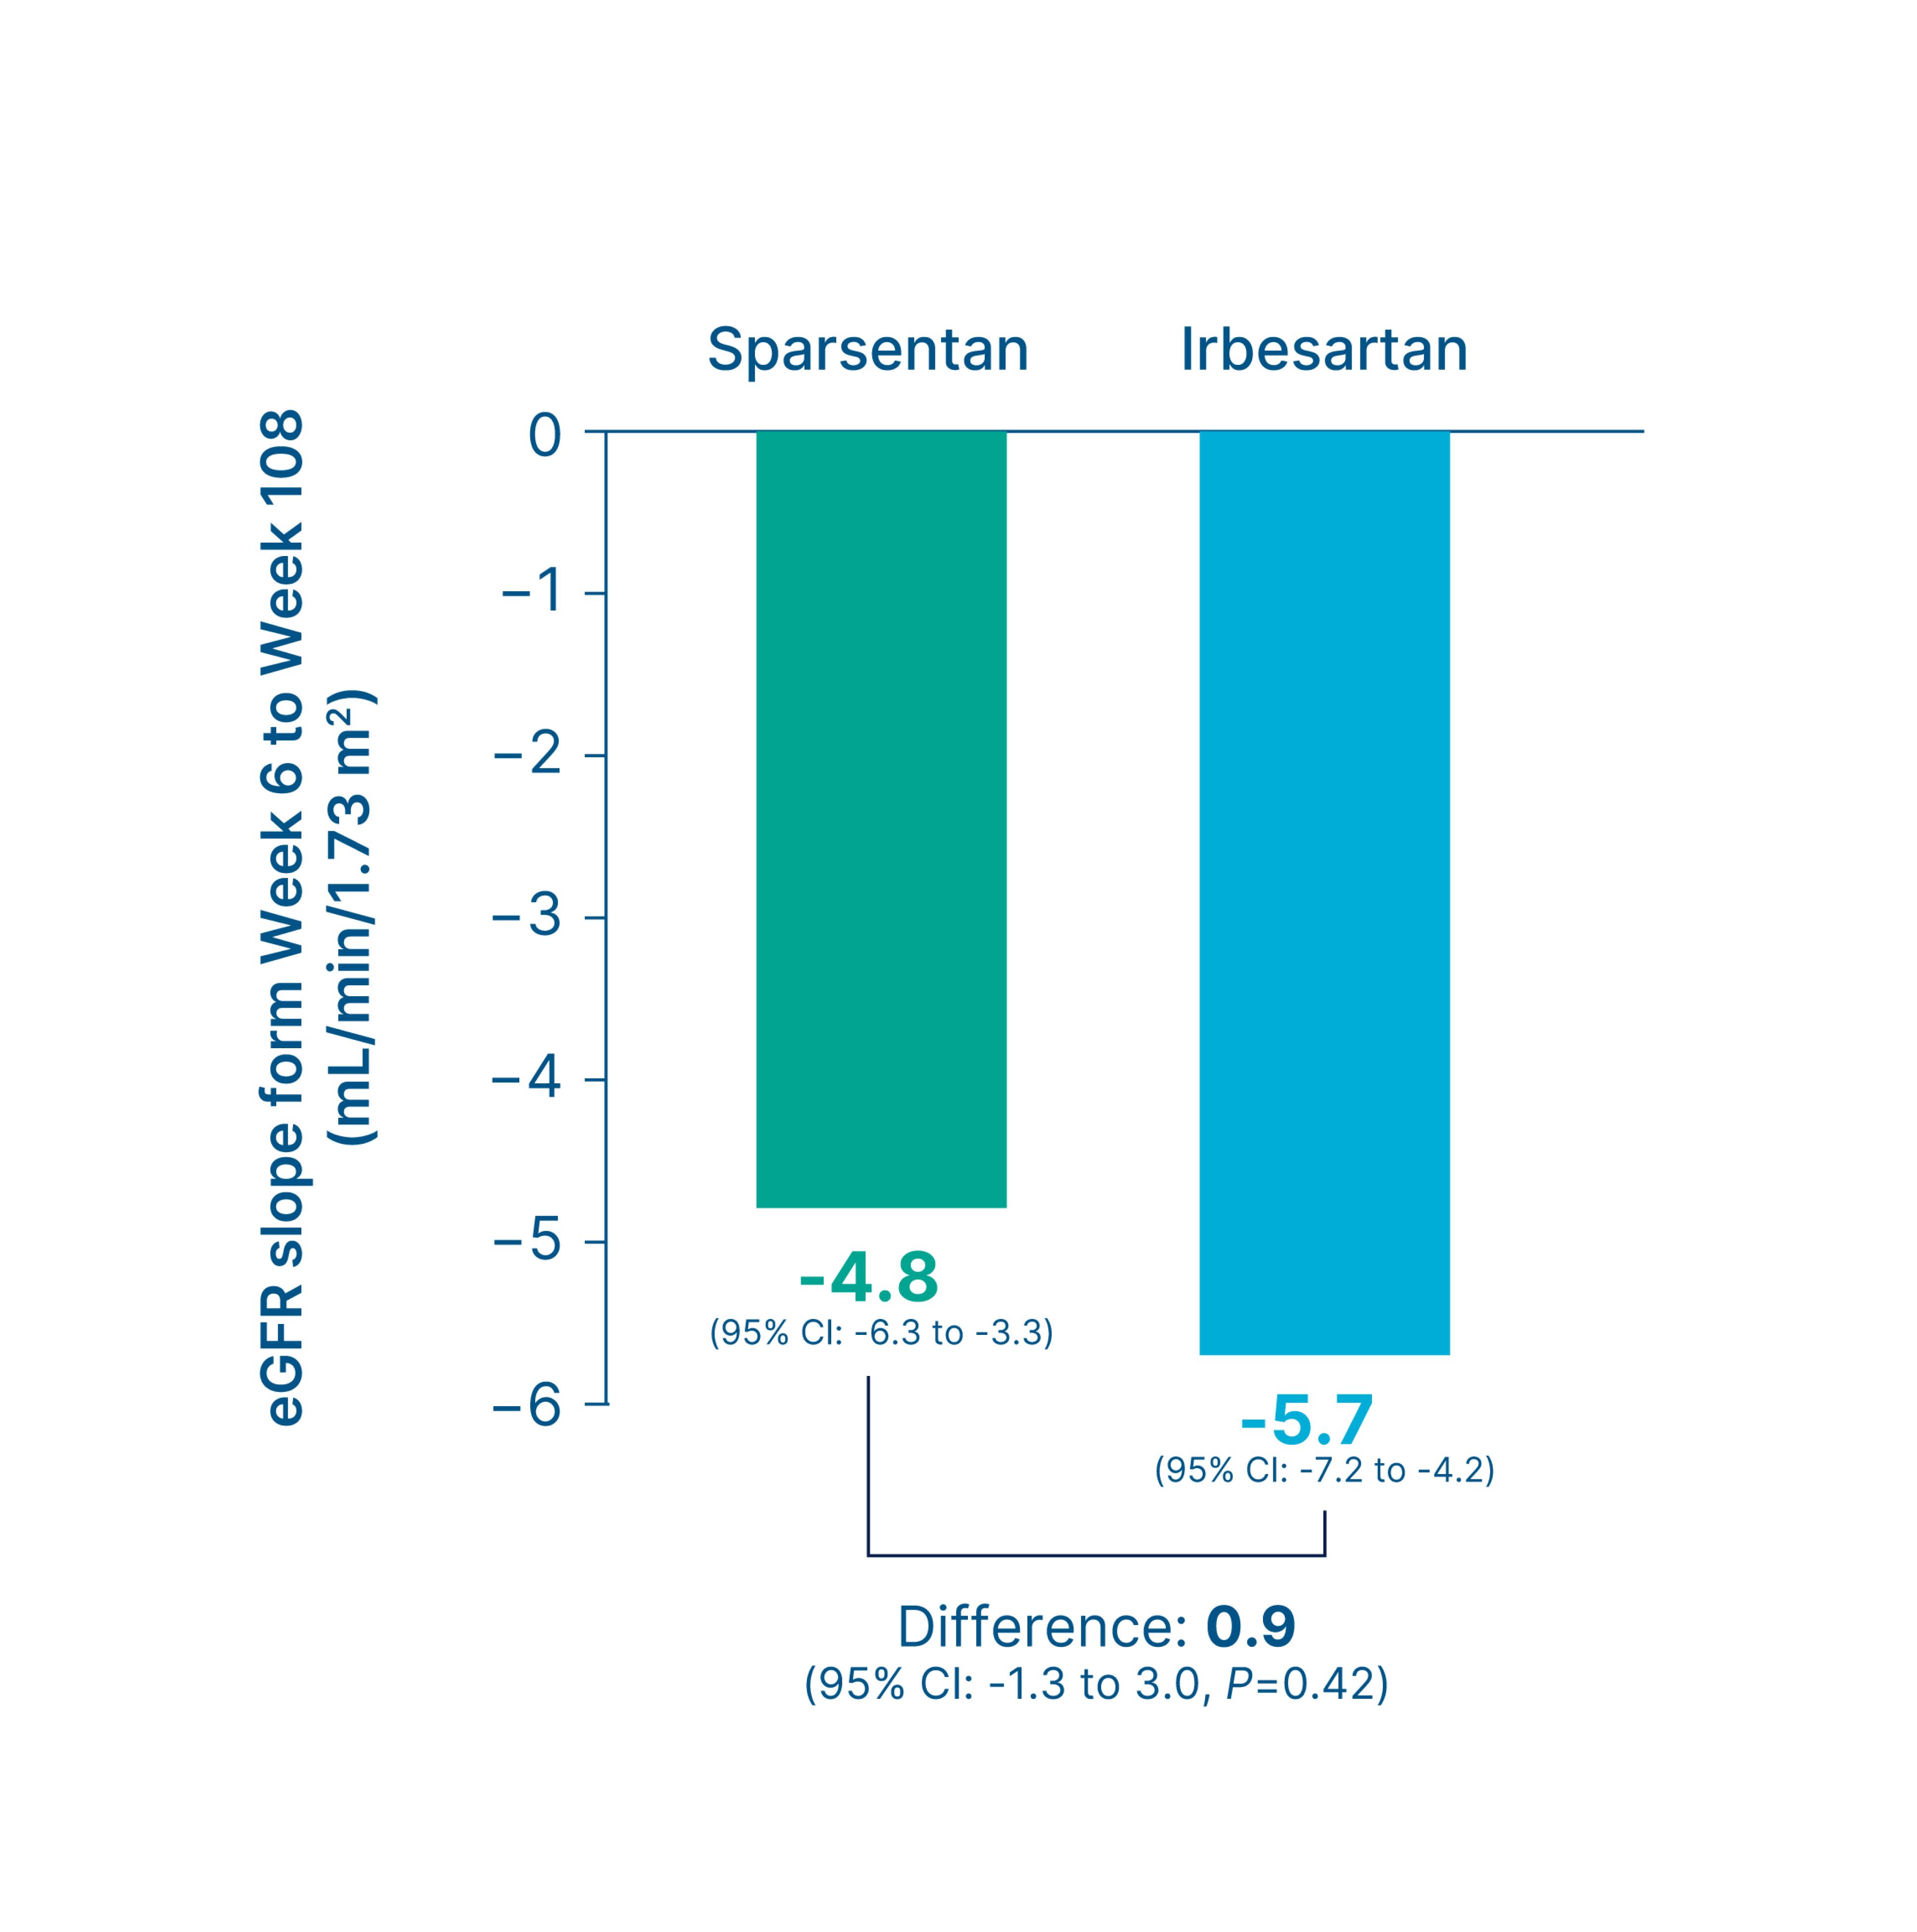
Estimated eGFR chronic slope or total slope
Primary/Secondary efficacy endpoint (varies by region)*
Chronic slope 3
Total slope 3
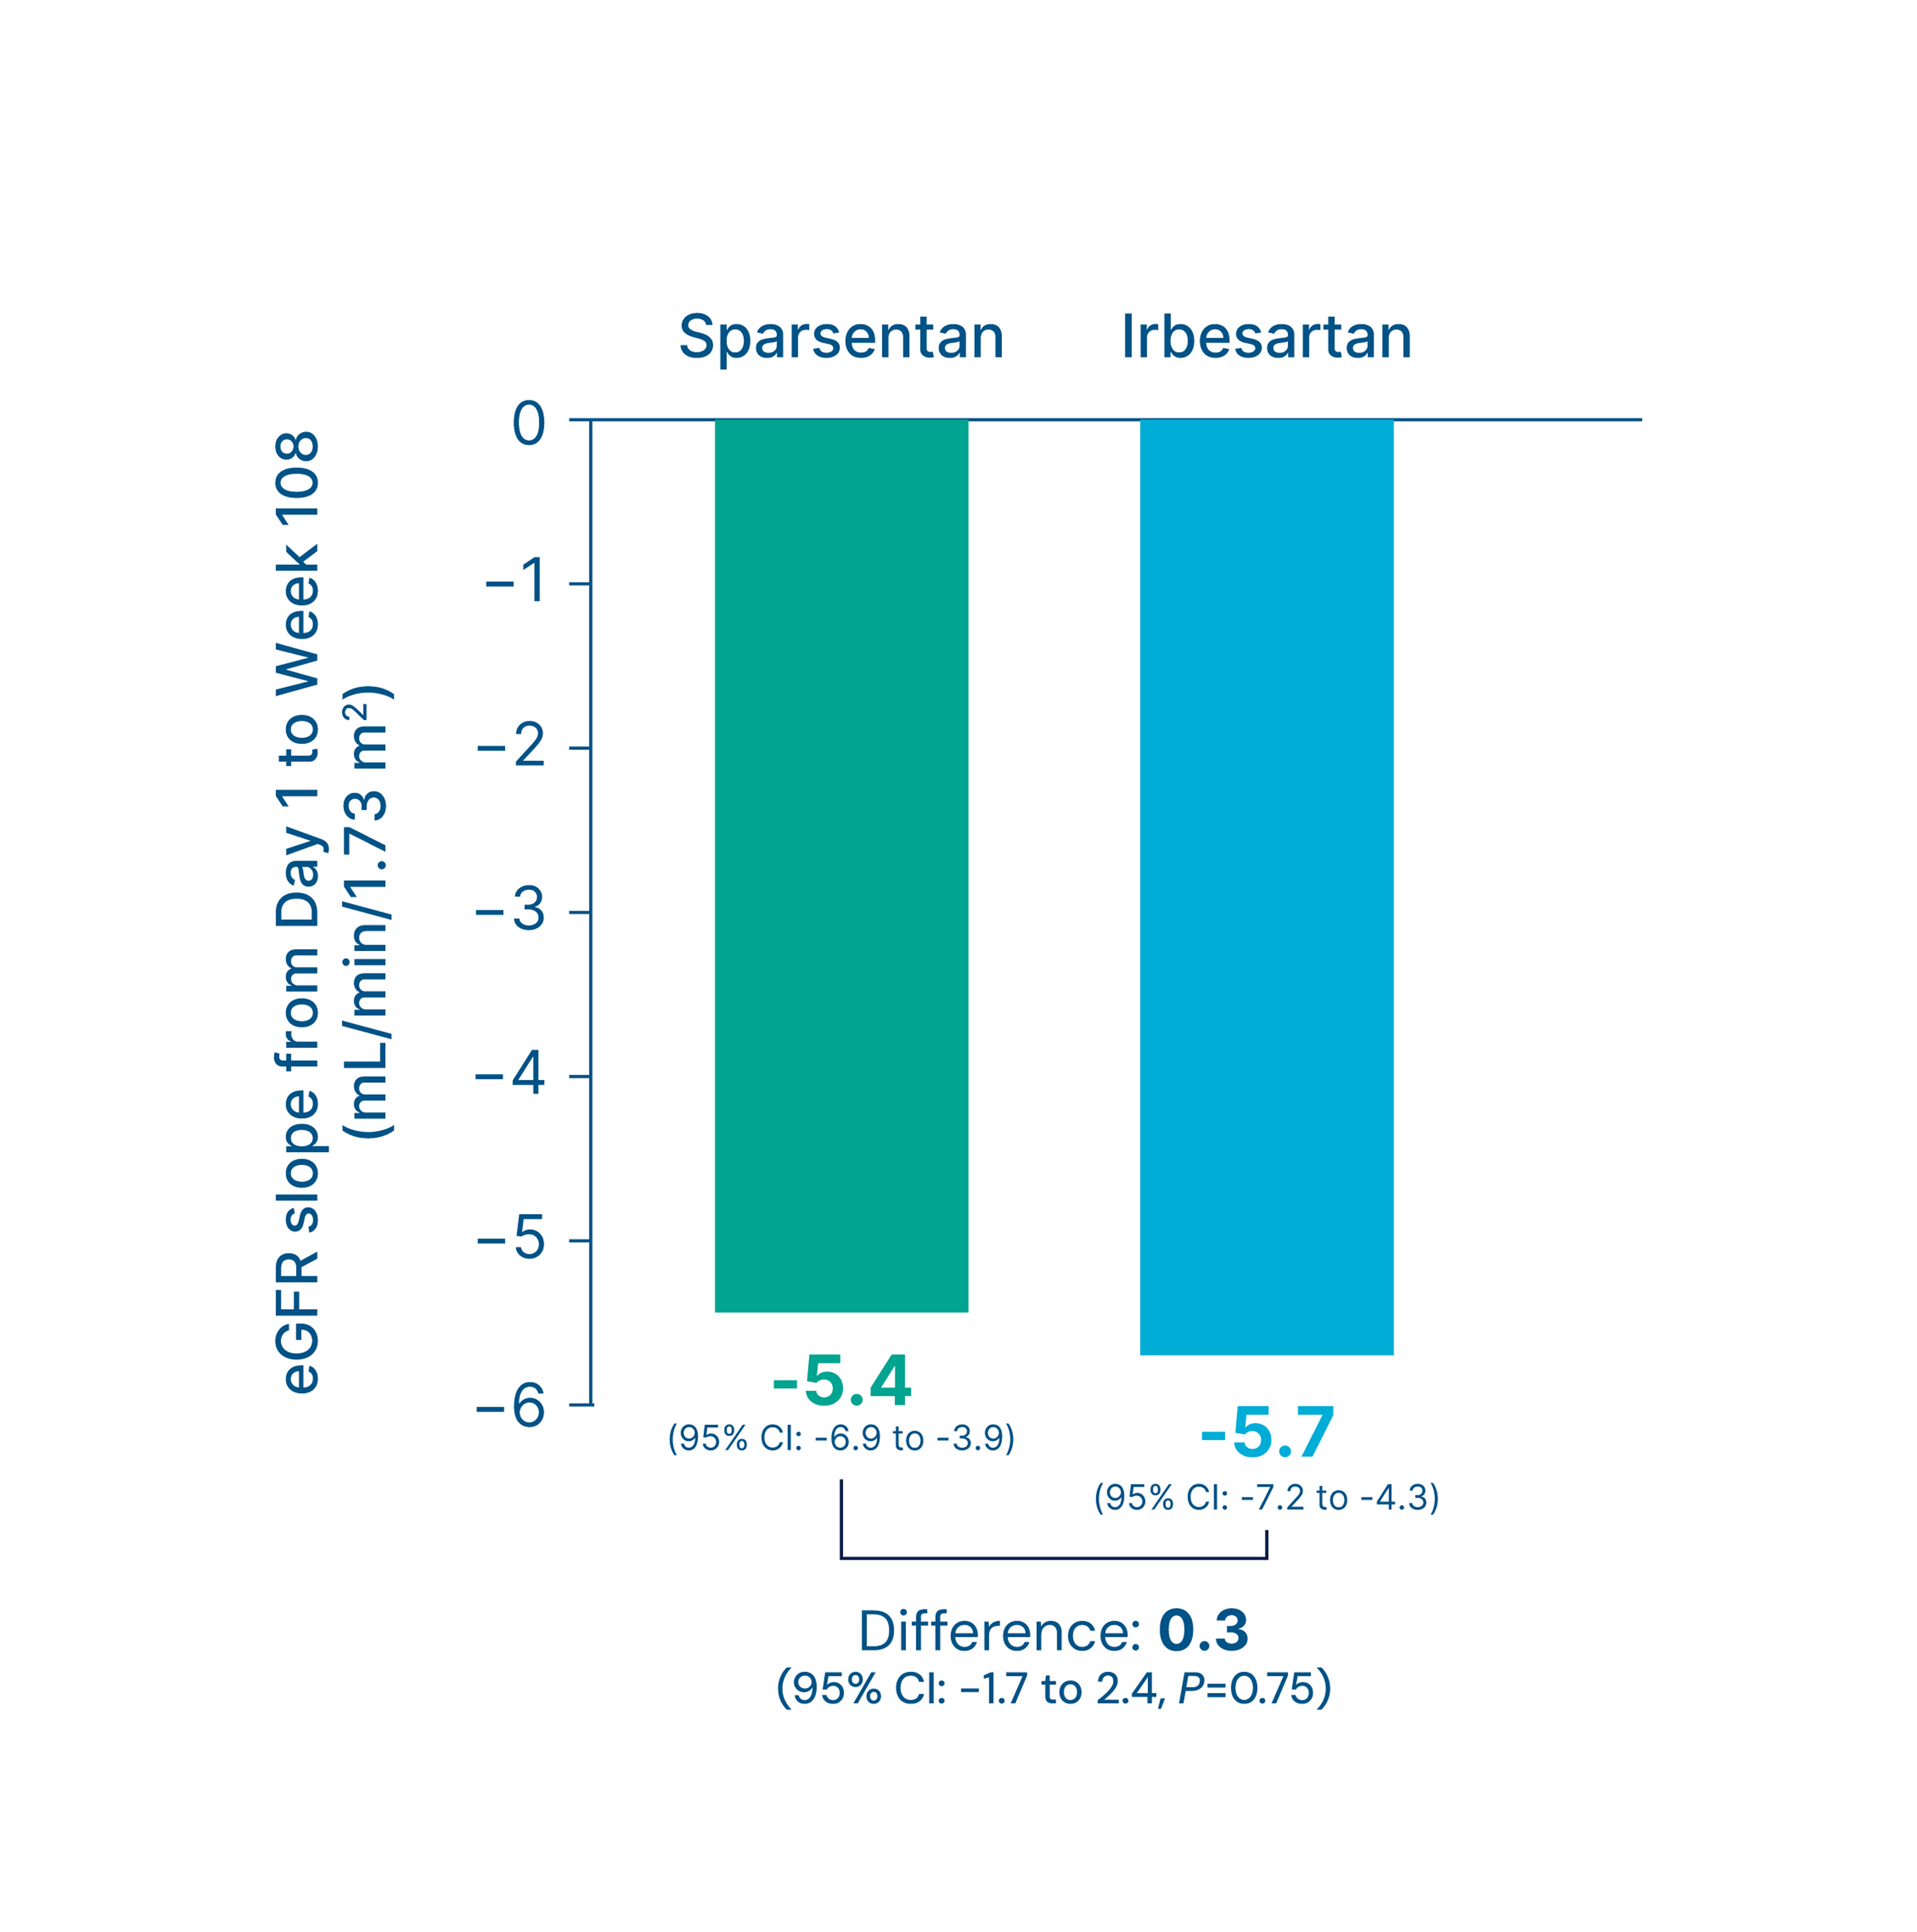
Summary
-
Numerical differences in eGFR slopes favored the sparsentan group versus the irbesartan group (mL/min/1.73 m2)
3
- Chronic slope (sparsentan vs. irbesartan): -4.8 vs. -5.7 (Difference: 0.9, 95% CI: -1.3 to 3.0, P=0.42) 3
- Total slope (sparsentan vs. irbesartan): -5.4 vs. -5.7 (Difference: 0.3, 95% CI: -1.7 to 2.4, P=0.75) 3
Footnotes
Kidney function (eGFR) at Week 112
Key secondary endpoint
Change in eGFR from baseline to Week 112 3
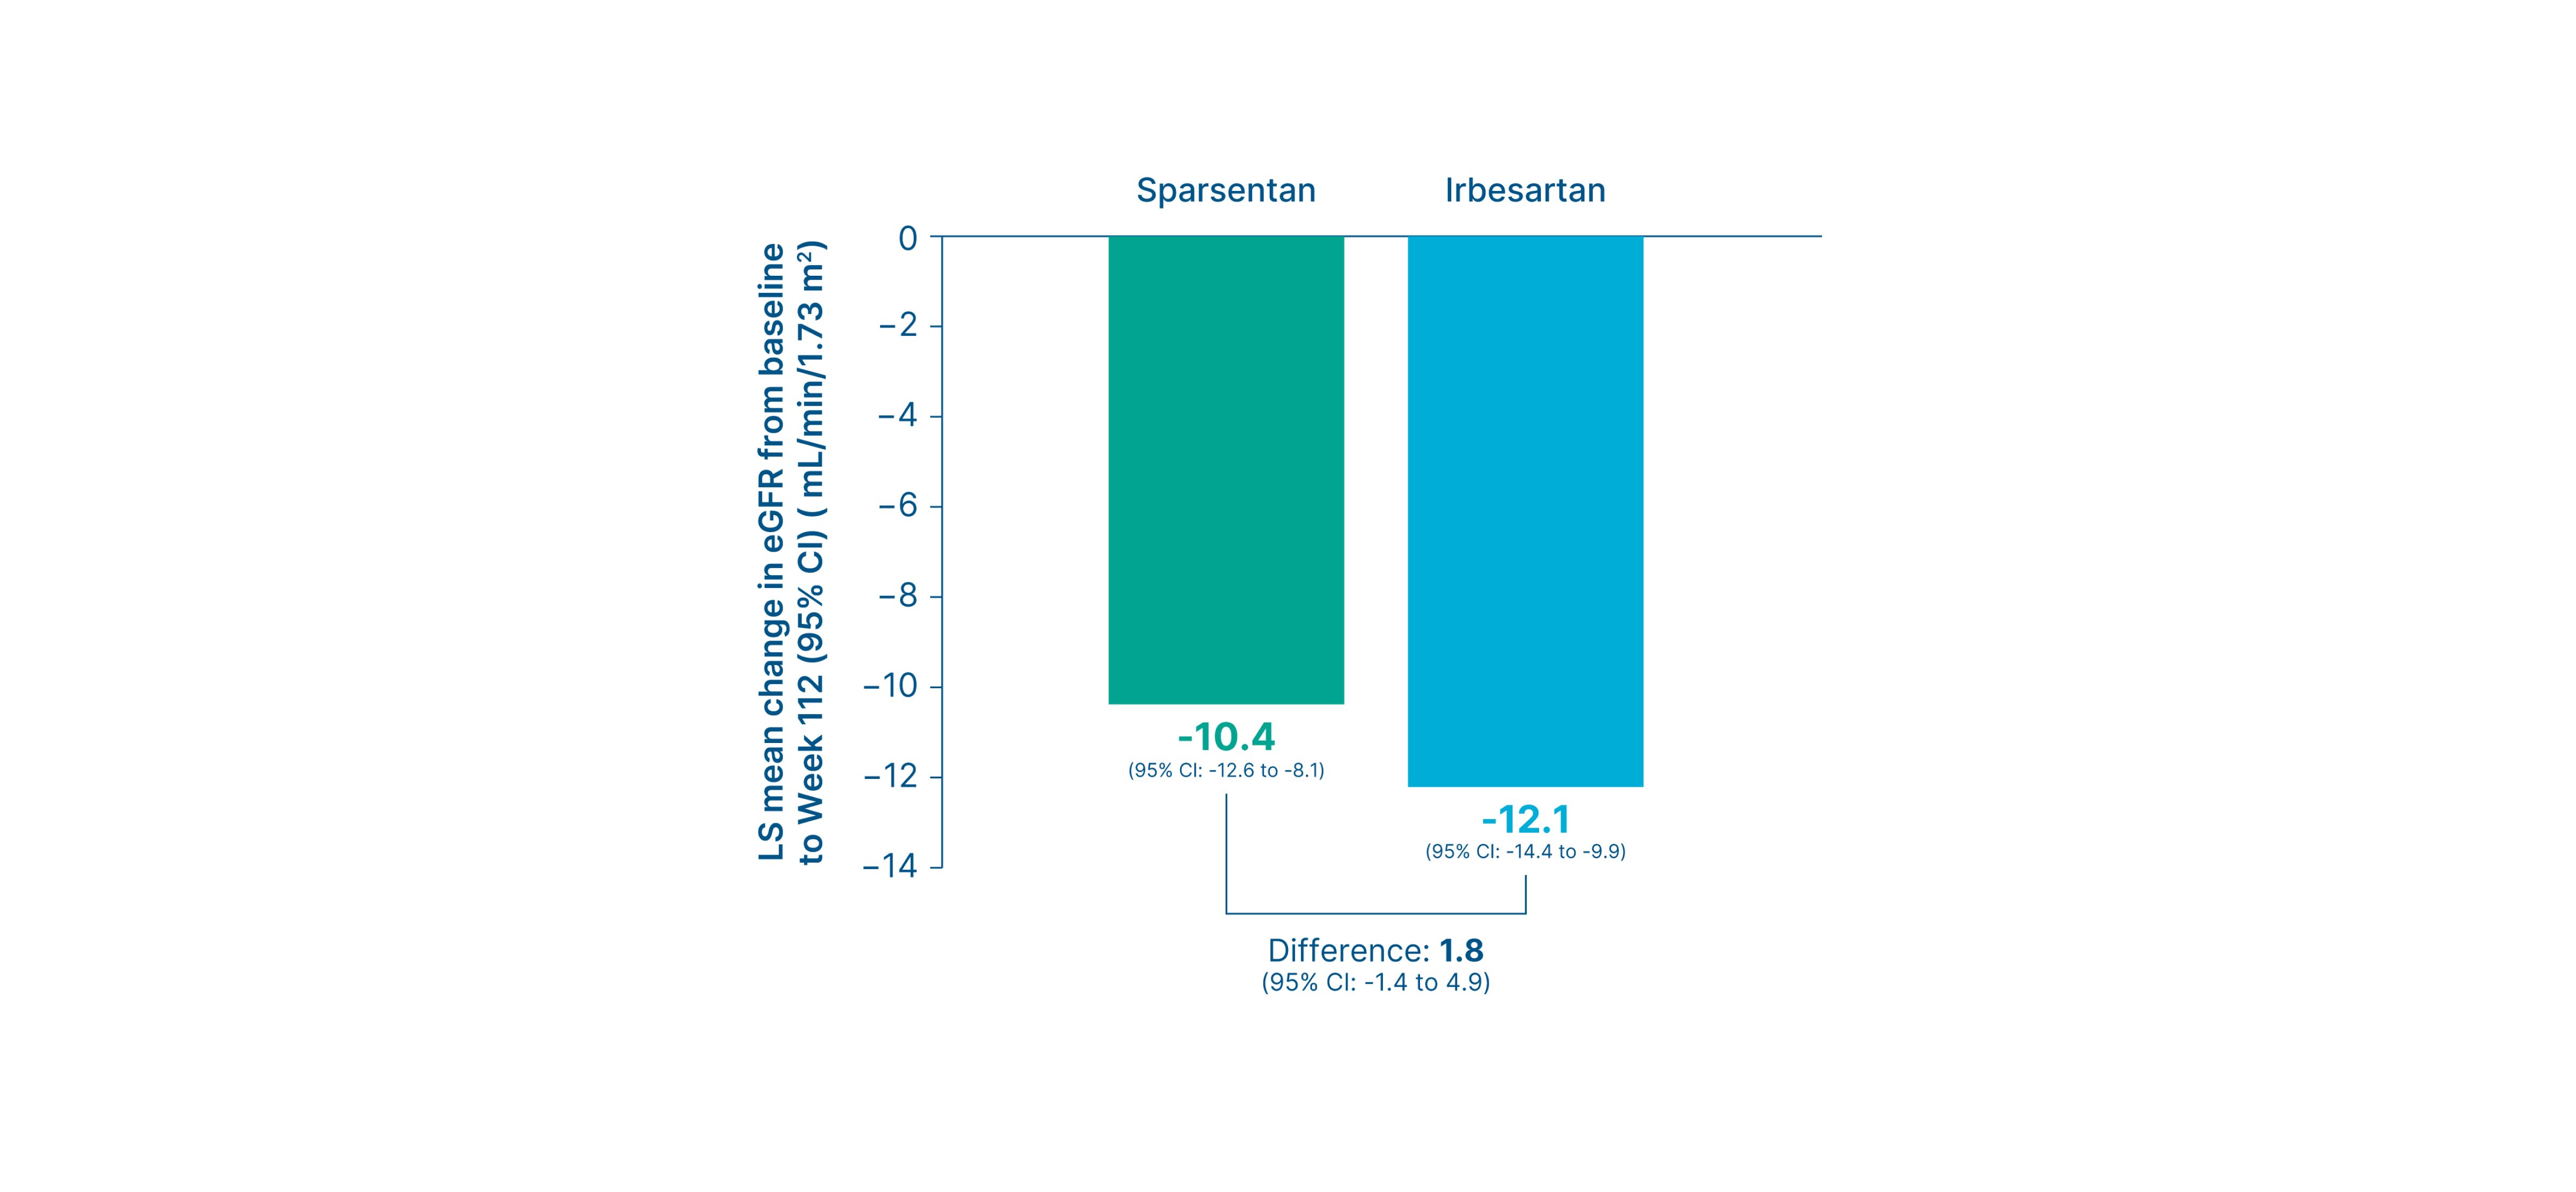
Summary
-
At Week 112, there was a smaller mean change from baseline in eGFR with sparsentan vs. irbesartan (mL/min/1.73 m2)
3
- Sparsentan vs. irbesartan: -10.4 vs. -12.1 (Difference: 1.8, 95% CI: -1.4 to 4.9) 3
Composite kidney failure endpoint at Week 108
Exploratory endpoint
Proportion of patients who reached the composite kidney failure endpoint 3
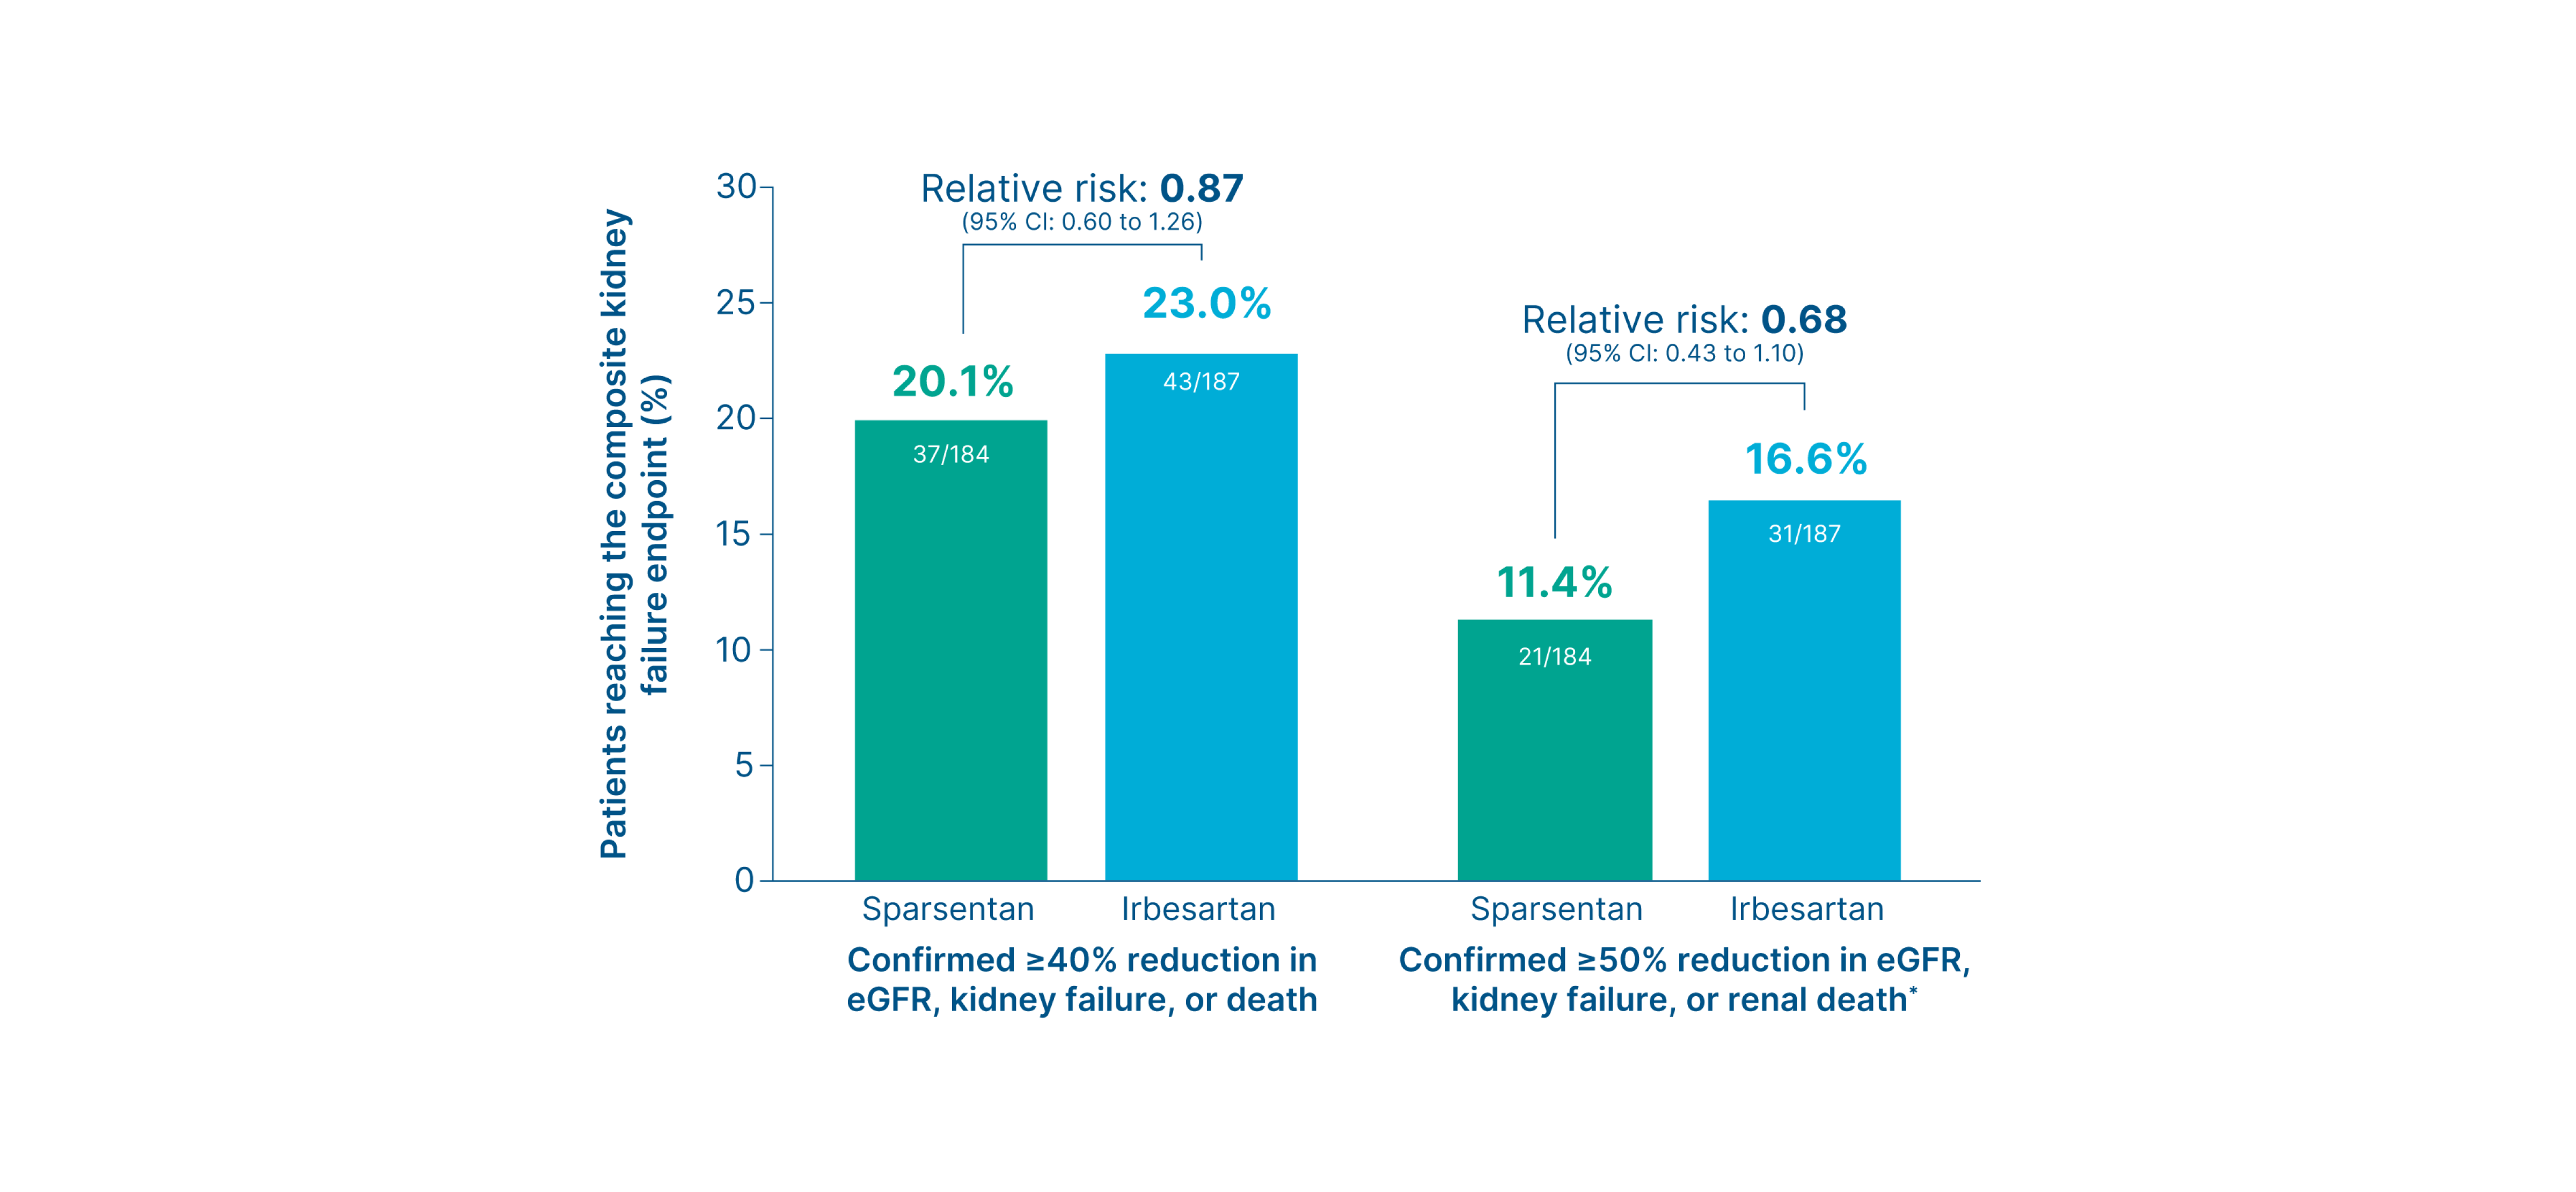
Summary
-
Fewer patients in the sparsentan group reached the composite kidney failure endpoints
3
- Confirmed ≥40% reduction in eGFR, kidney failure, or death (sparsentan vs. irbesartan): 20% vs. 23% (Relative risk: 0.87, 95% CI: 0.60 to 1.26) 3
- Confirmed ≥50% reduction in eGFR, kidney failure, or kidney death (sparsentan vs. irbesartan): 11% vs. 17% (Relative risk: 0.68, 95% CI: 0.43 to 1.10) 3
- Fewer patients in the sparsentan group progressed to kidney failure compared to the irbesartan group 3
Footnotes
*Renal death is defined as death in a patient who reached kidney failure before initiating renal replacement therapy for whom another cause of death was not reported. 10
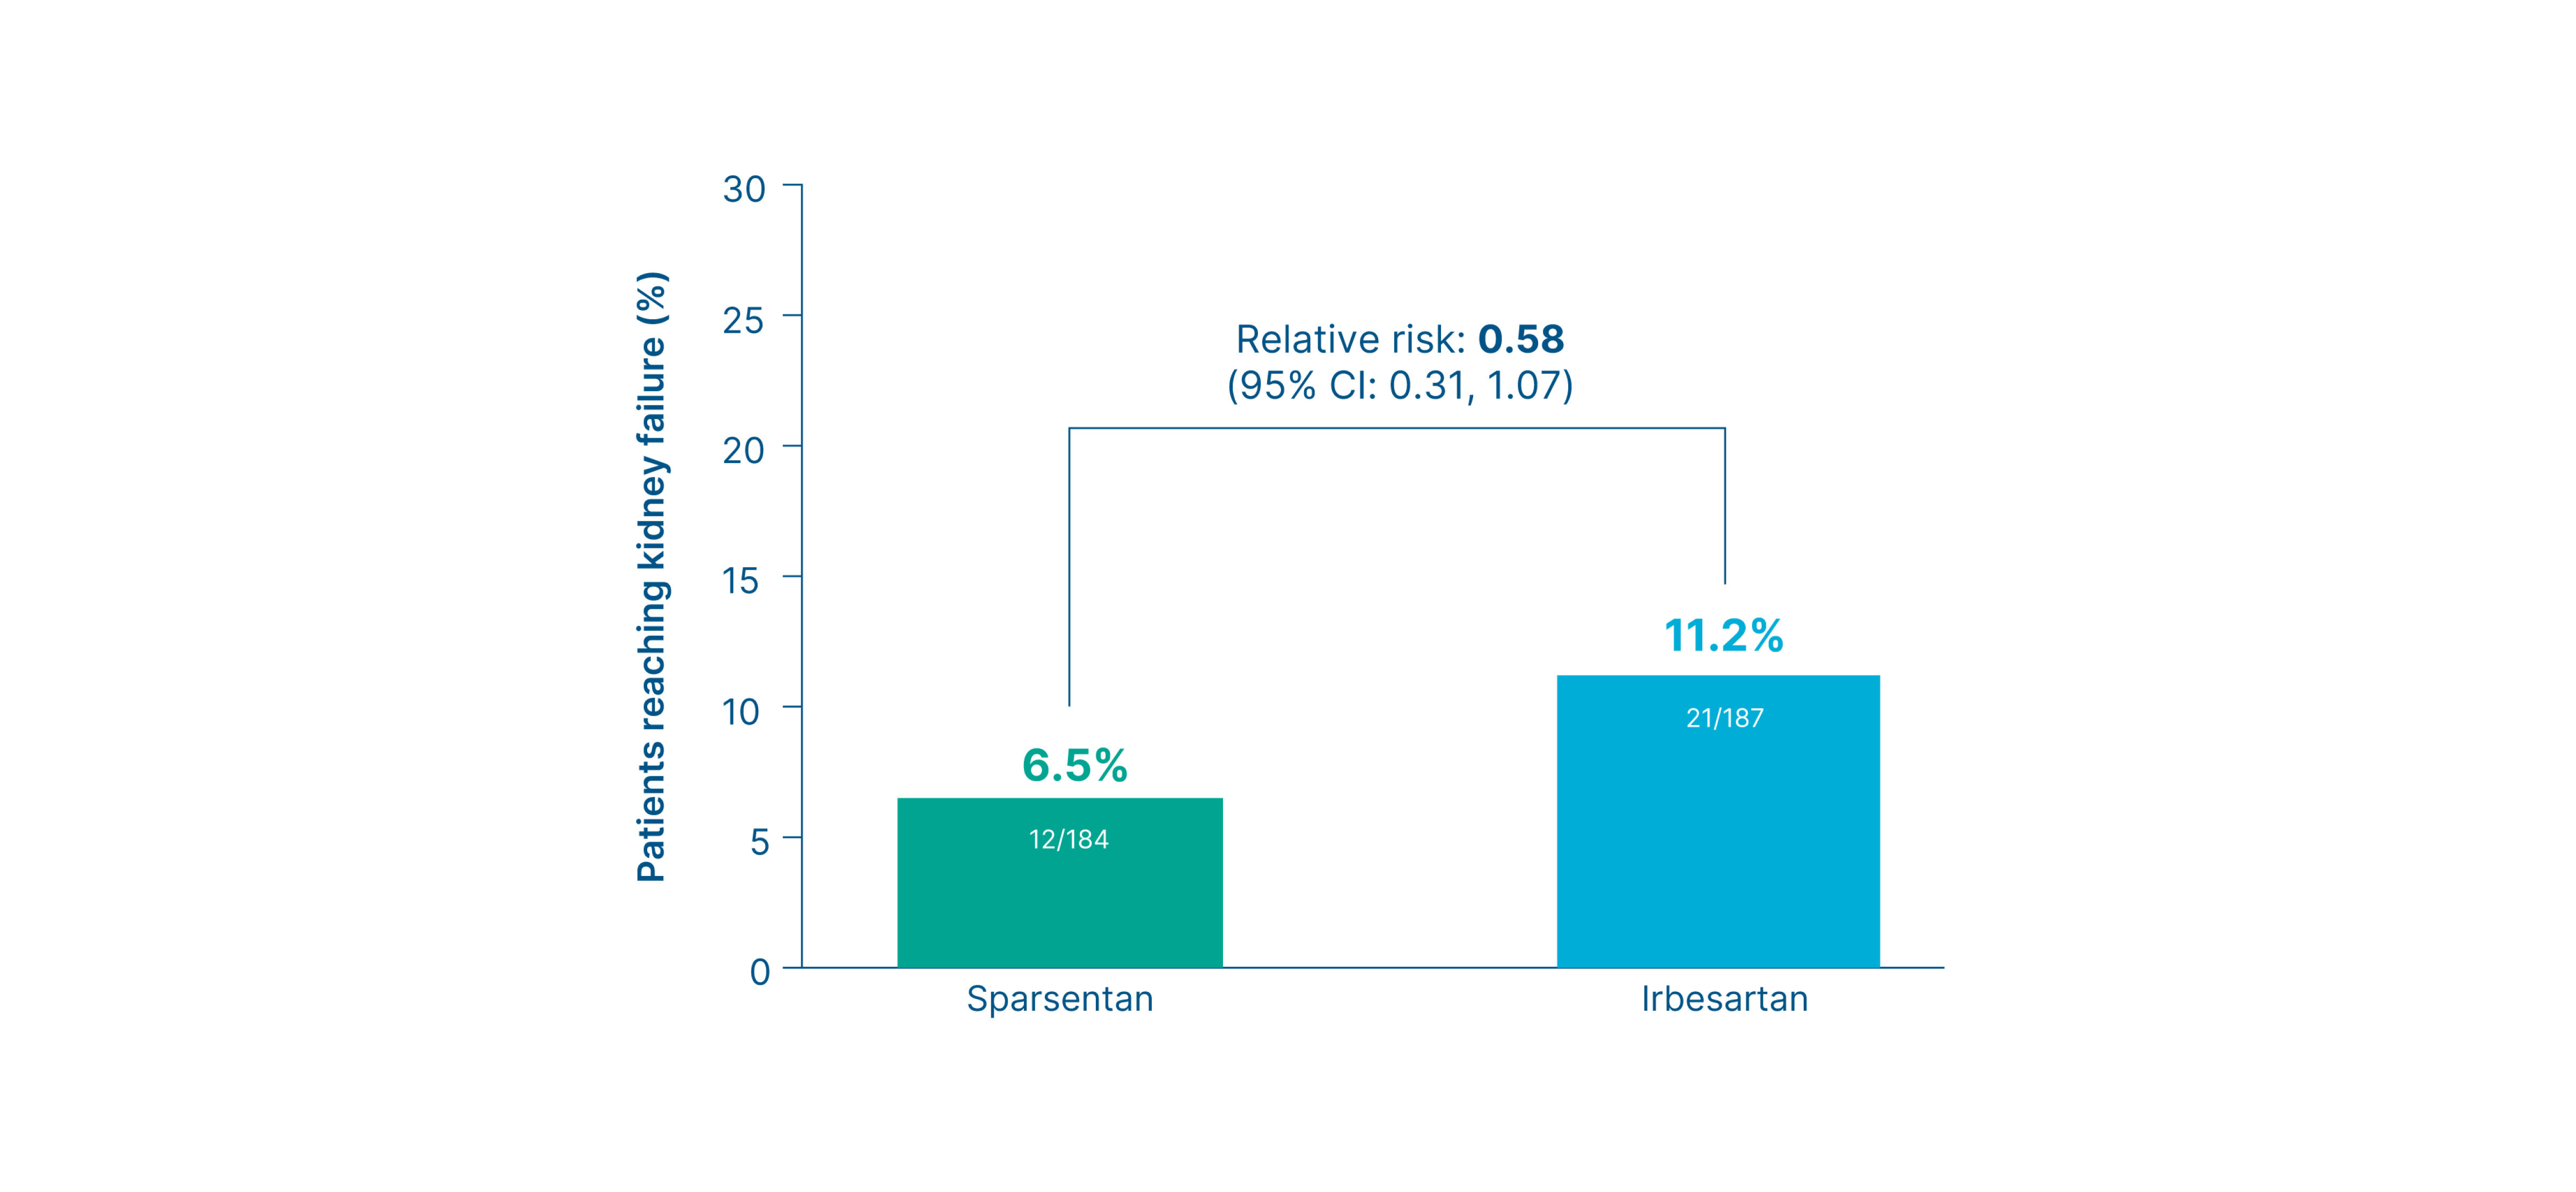
Risk of kidney failure
Post hoc exploratory efficacy endpoint
Proportion of patients who progressed to kidney failure 6, 13
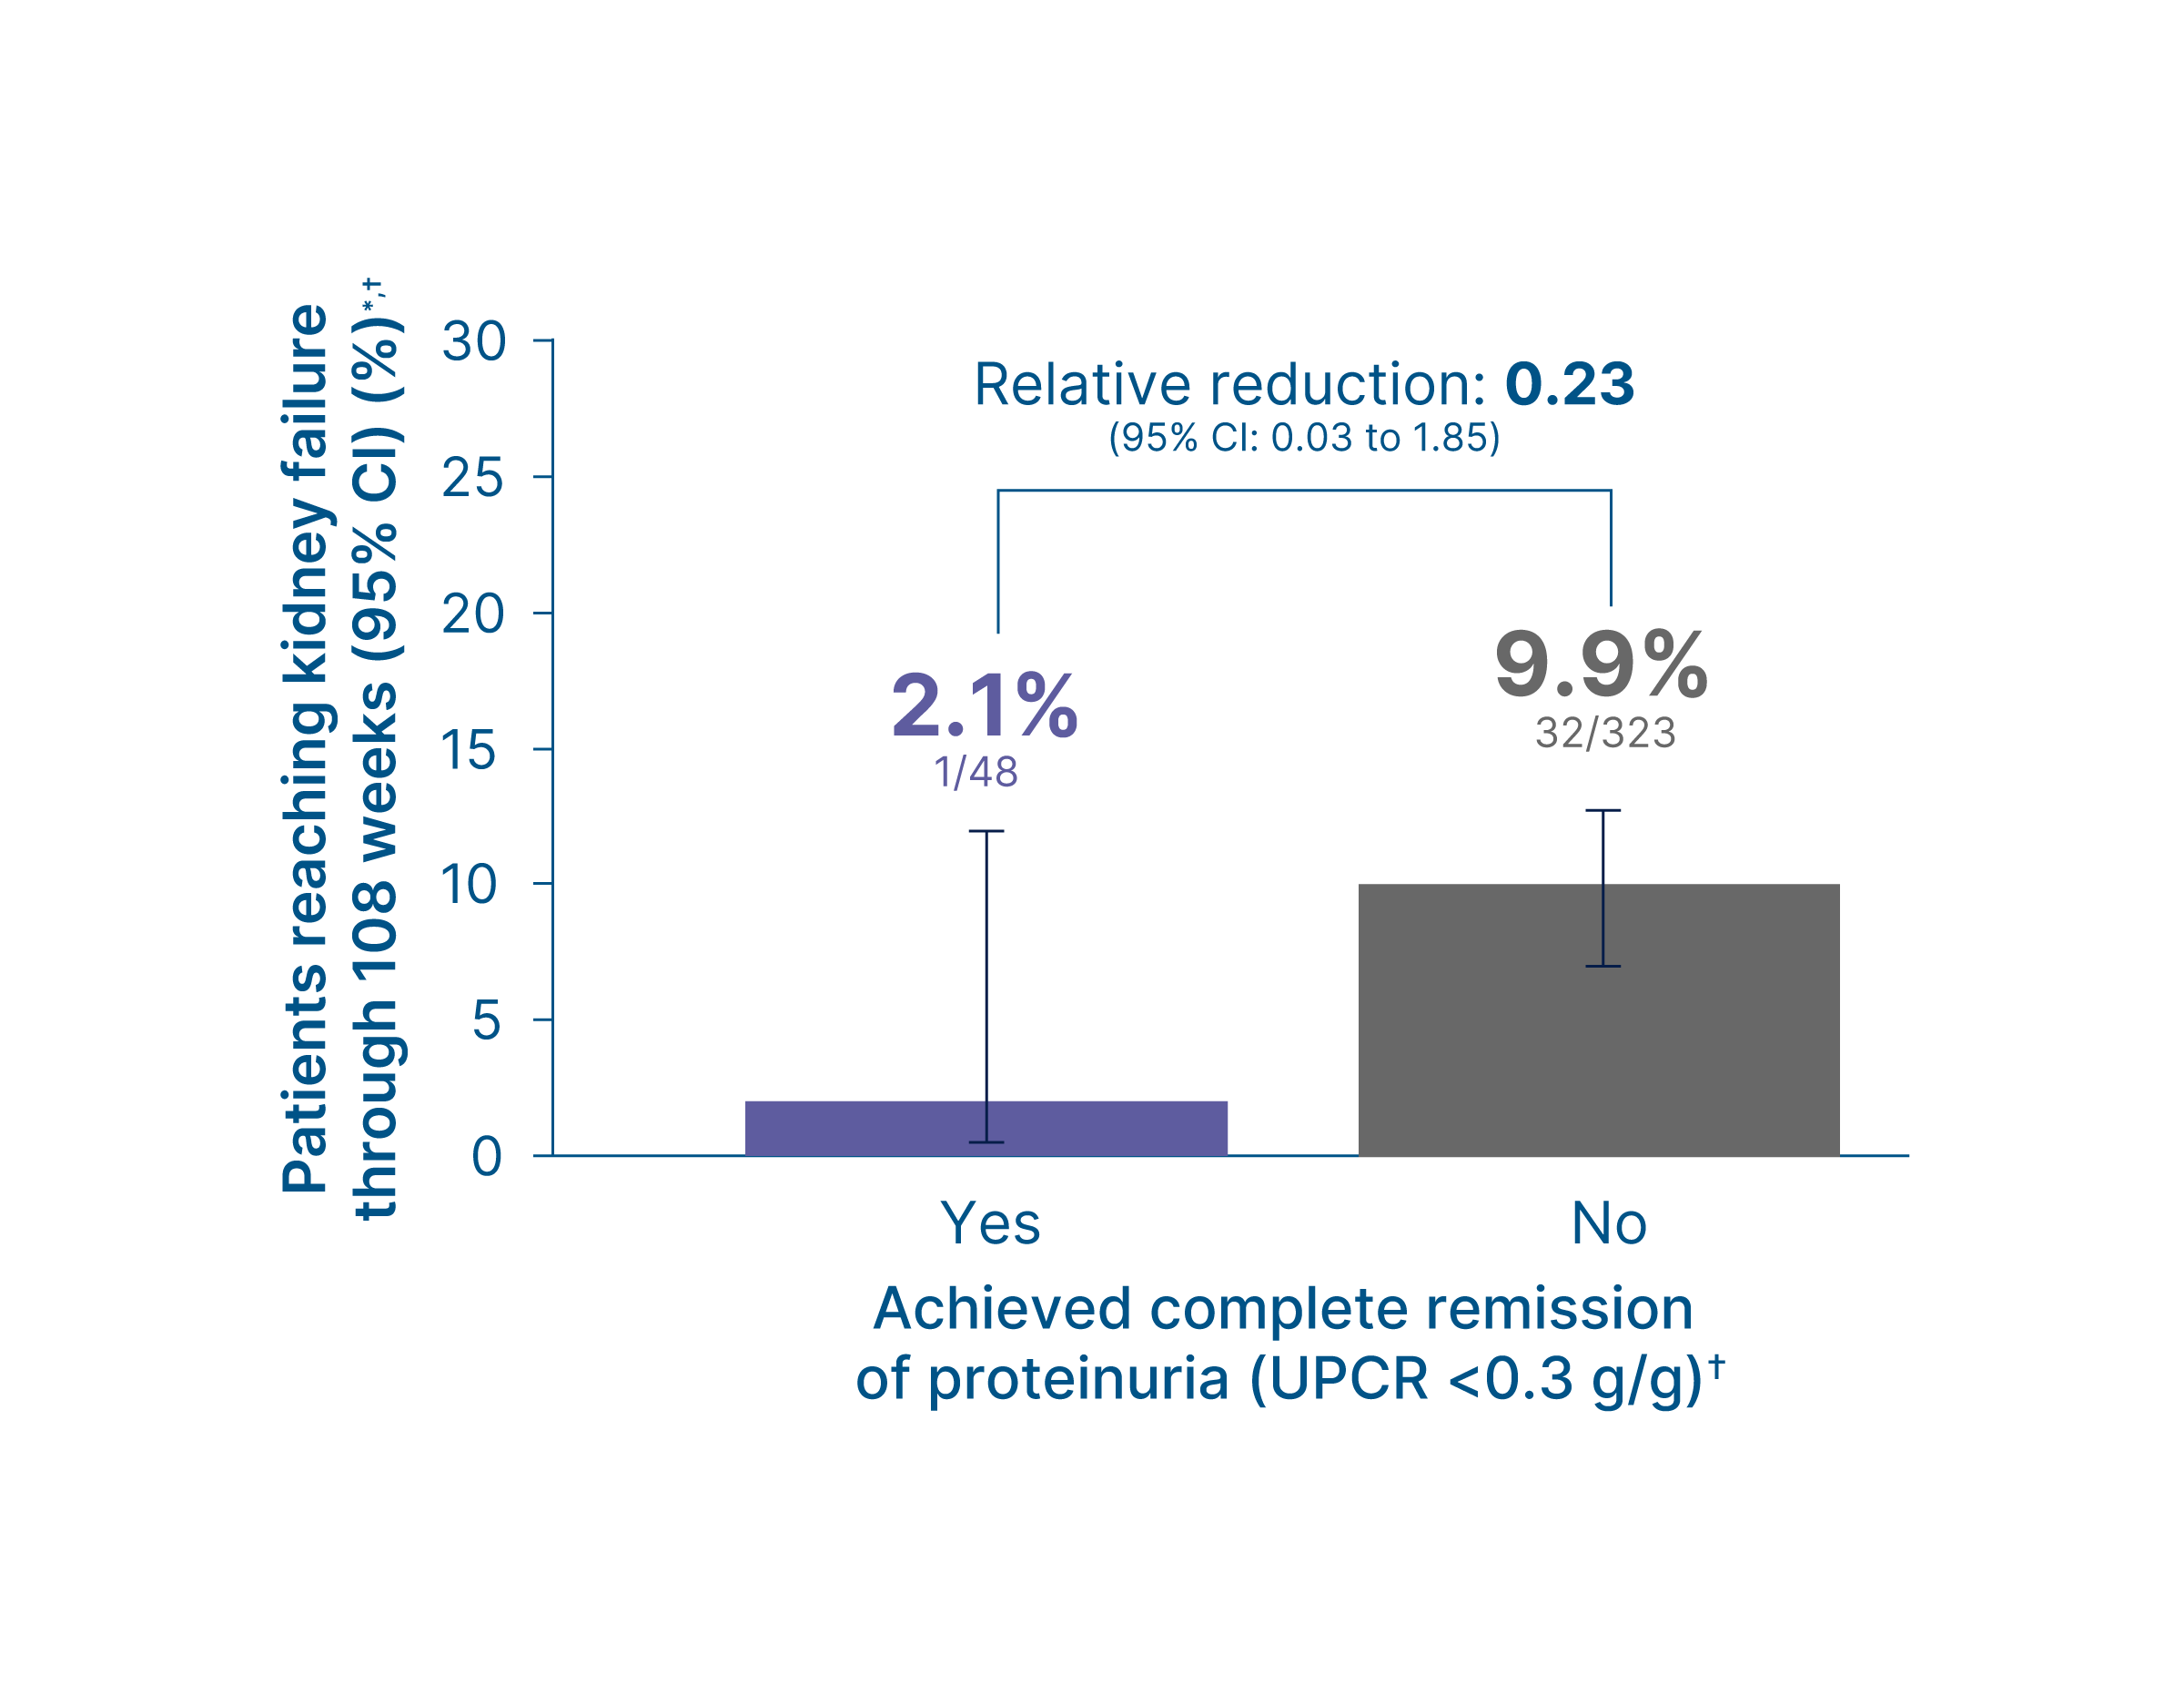
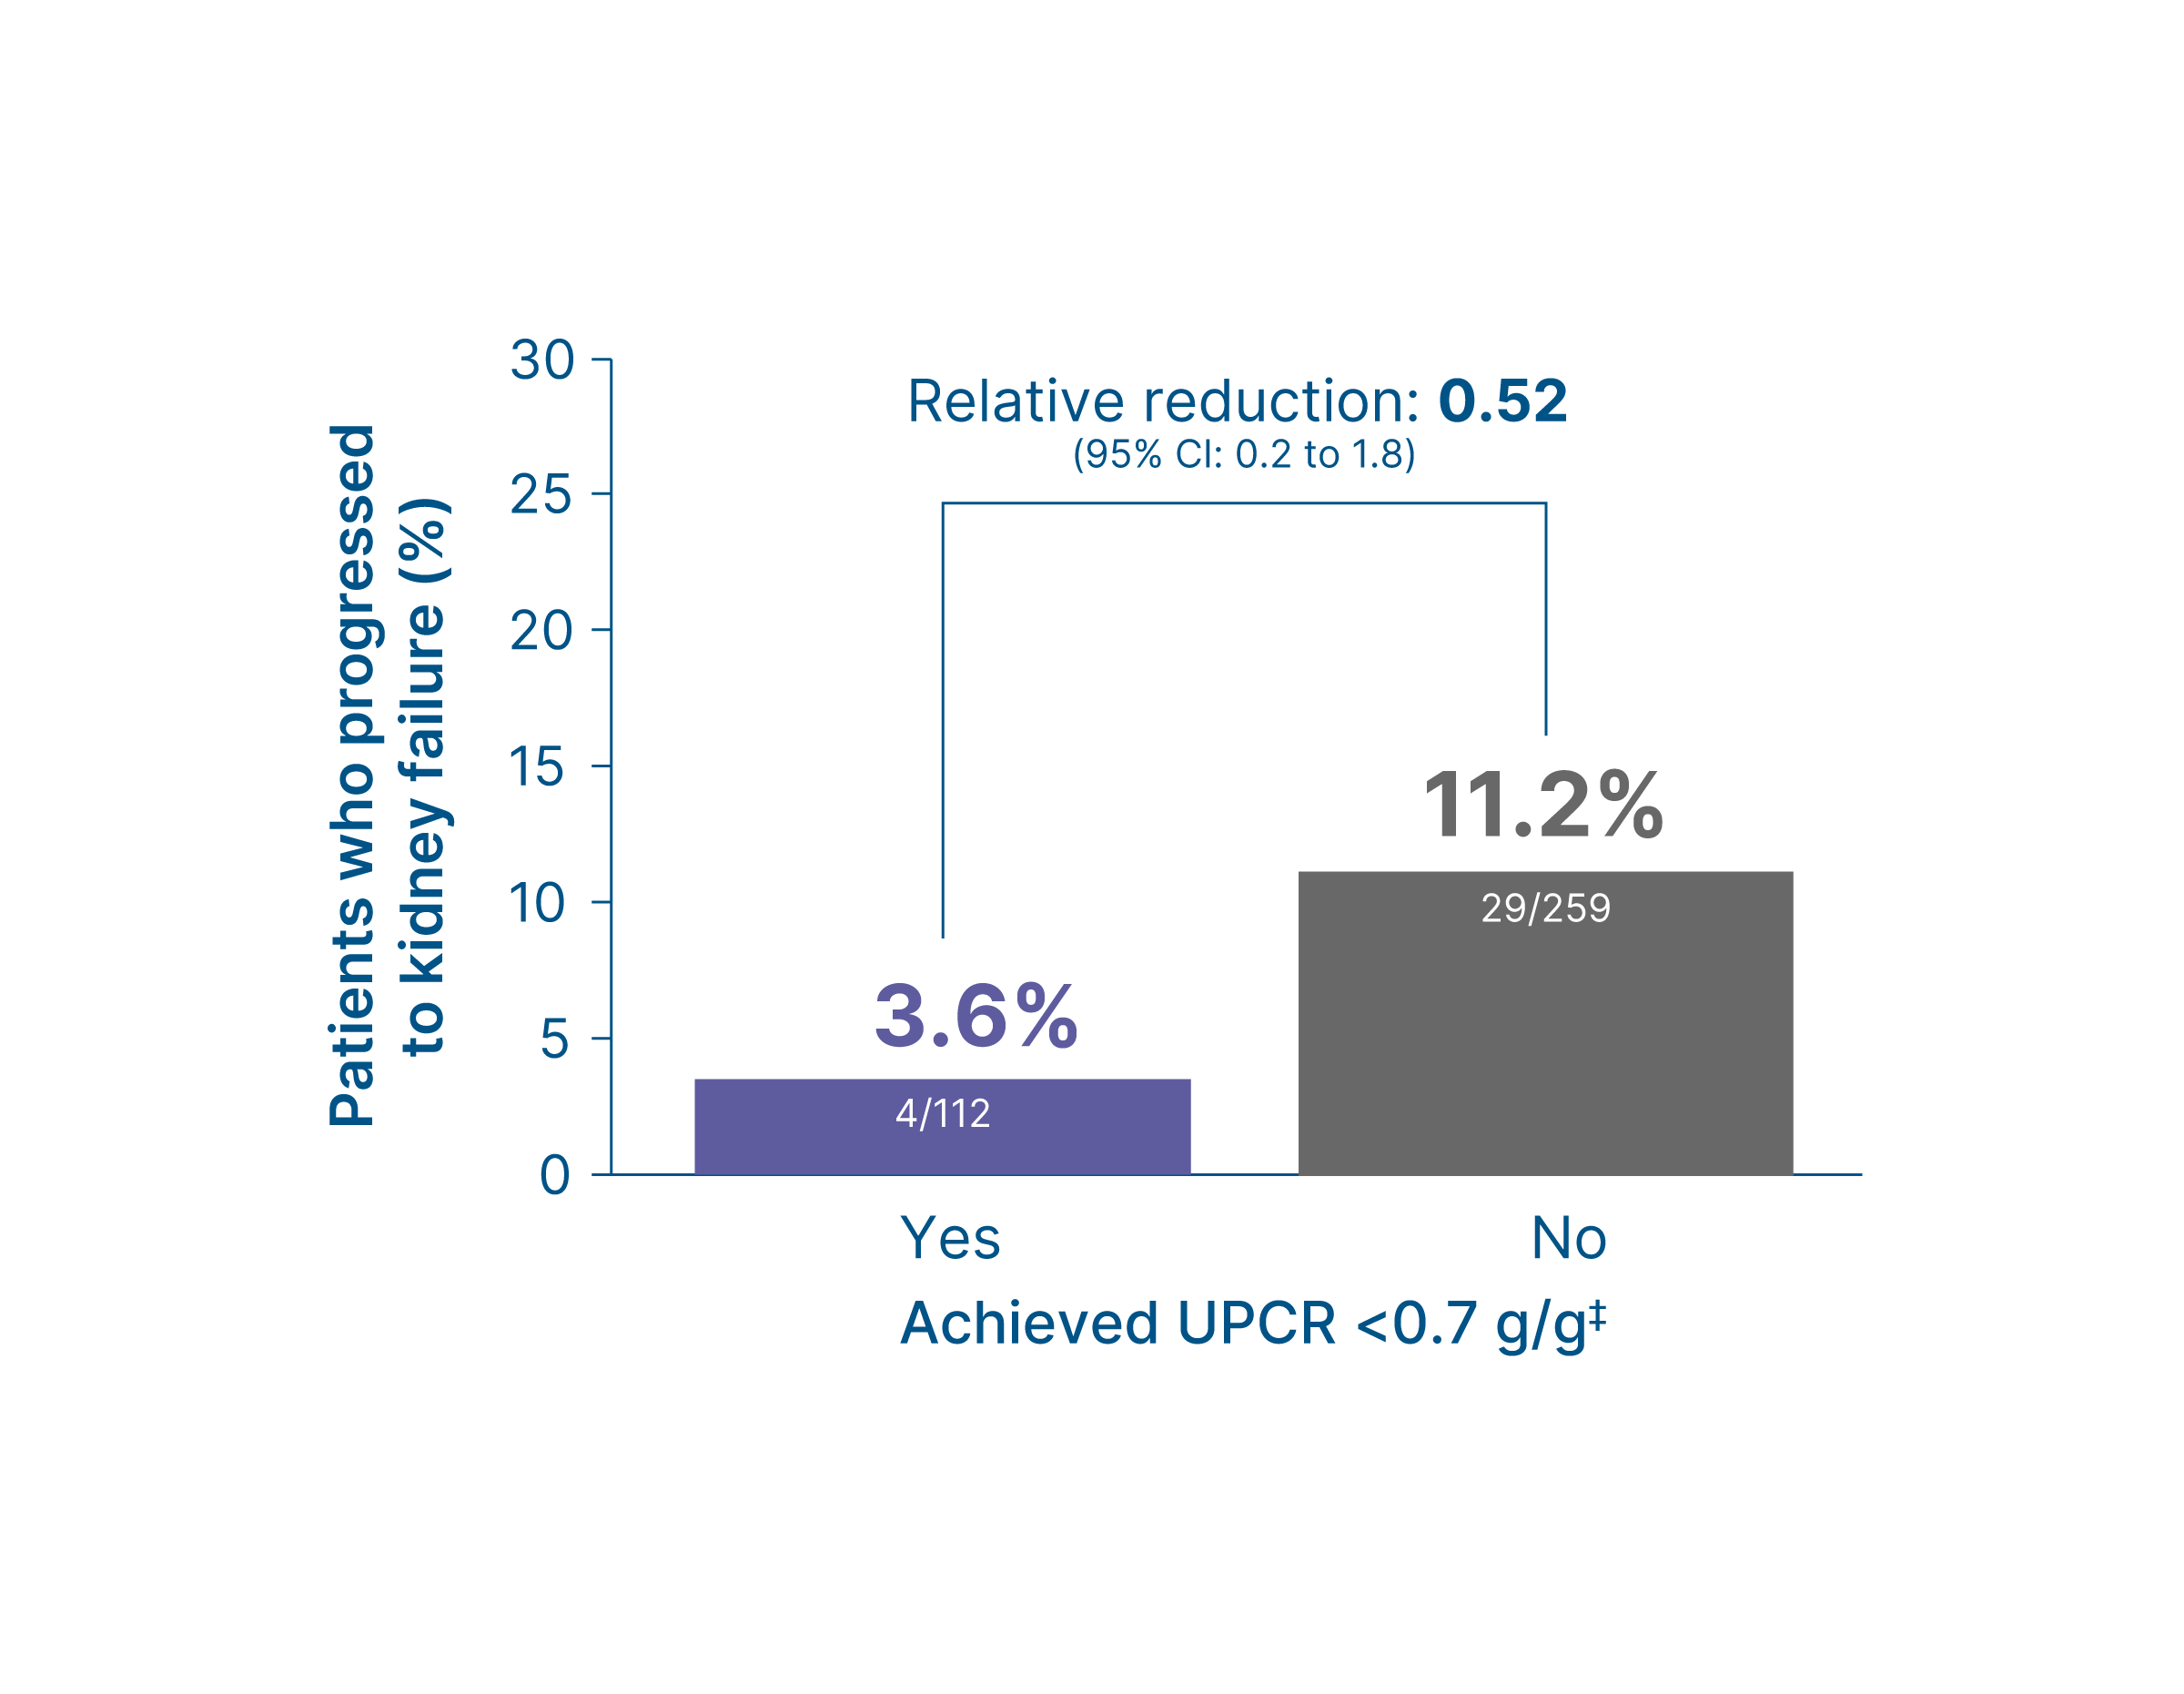
Summary
-
Irrespective of treatment arm, fewer patients who achieved complete remission of proteinuria (UPCR of <0.3 g/g) or UPCR <0.7 g/g‡ reached kidney failure compared to those who did not
6,
13
- Achieved complete remission of proteinuria (UPCR of <0.3 g/g) (yes vs. no): 2% vs. 10% (Relative risk: 0.23, 95% CI: 0.03 to 1.85) 13
- Achieved UPCR <0.7 g/g (yes vs. no): 4% vs. 11% (Relative risk: 0.52, 95% CI: 0.2 to 1.8) 6
Footnotes
*Results from
Proteinuria (UPCR) at Week 108
Without nephrotic syndrome subgroup analysis*
Change in UPCR from baseline up to Week 108 (FAS) 4, 5, 14†
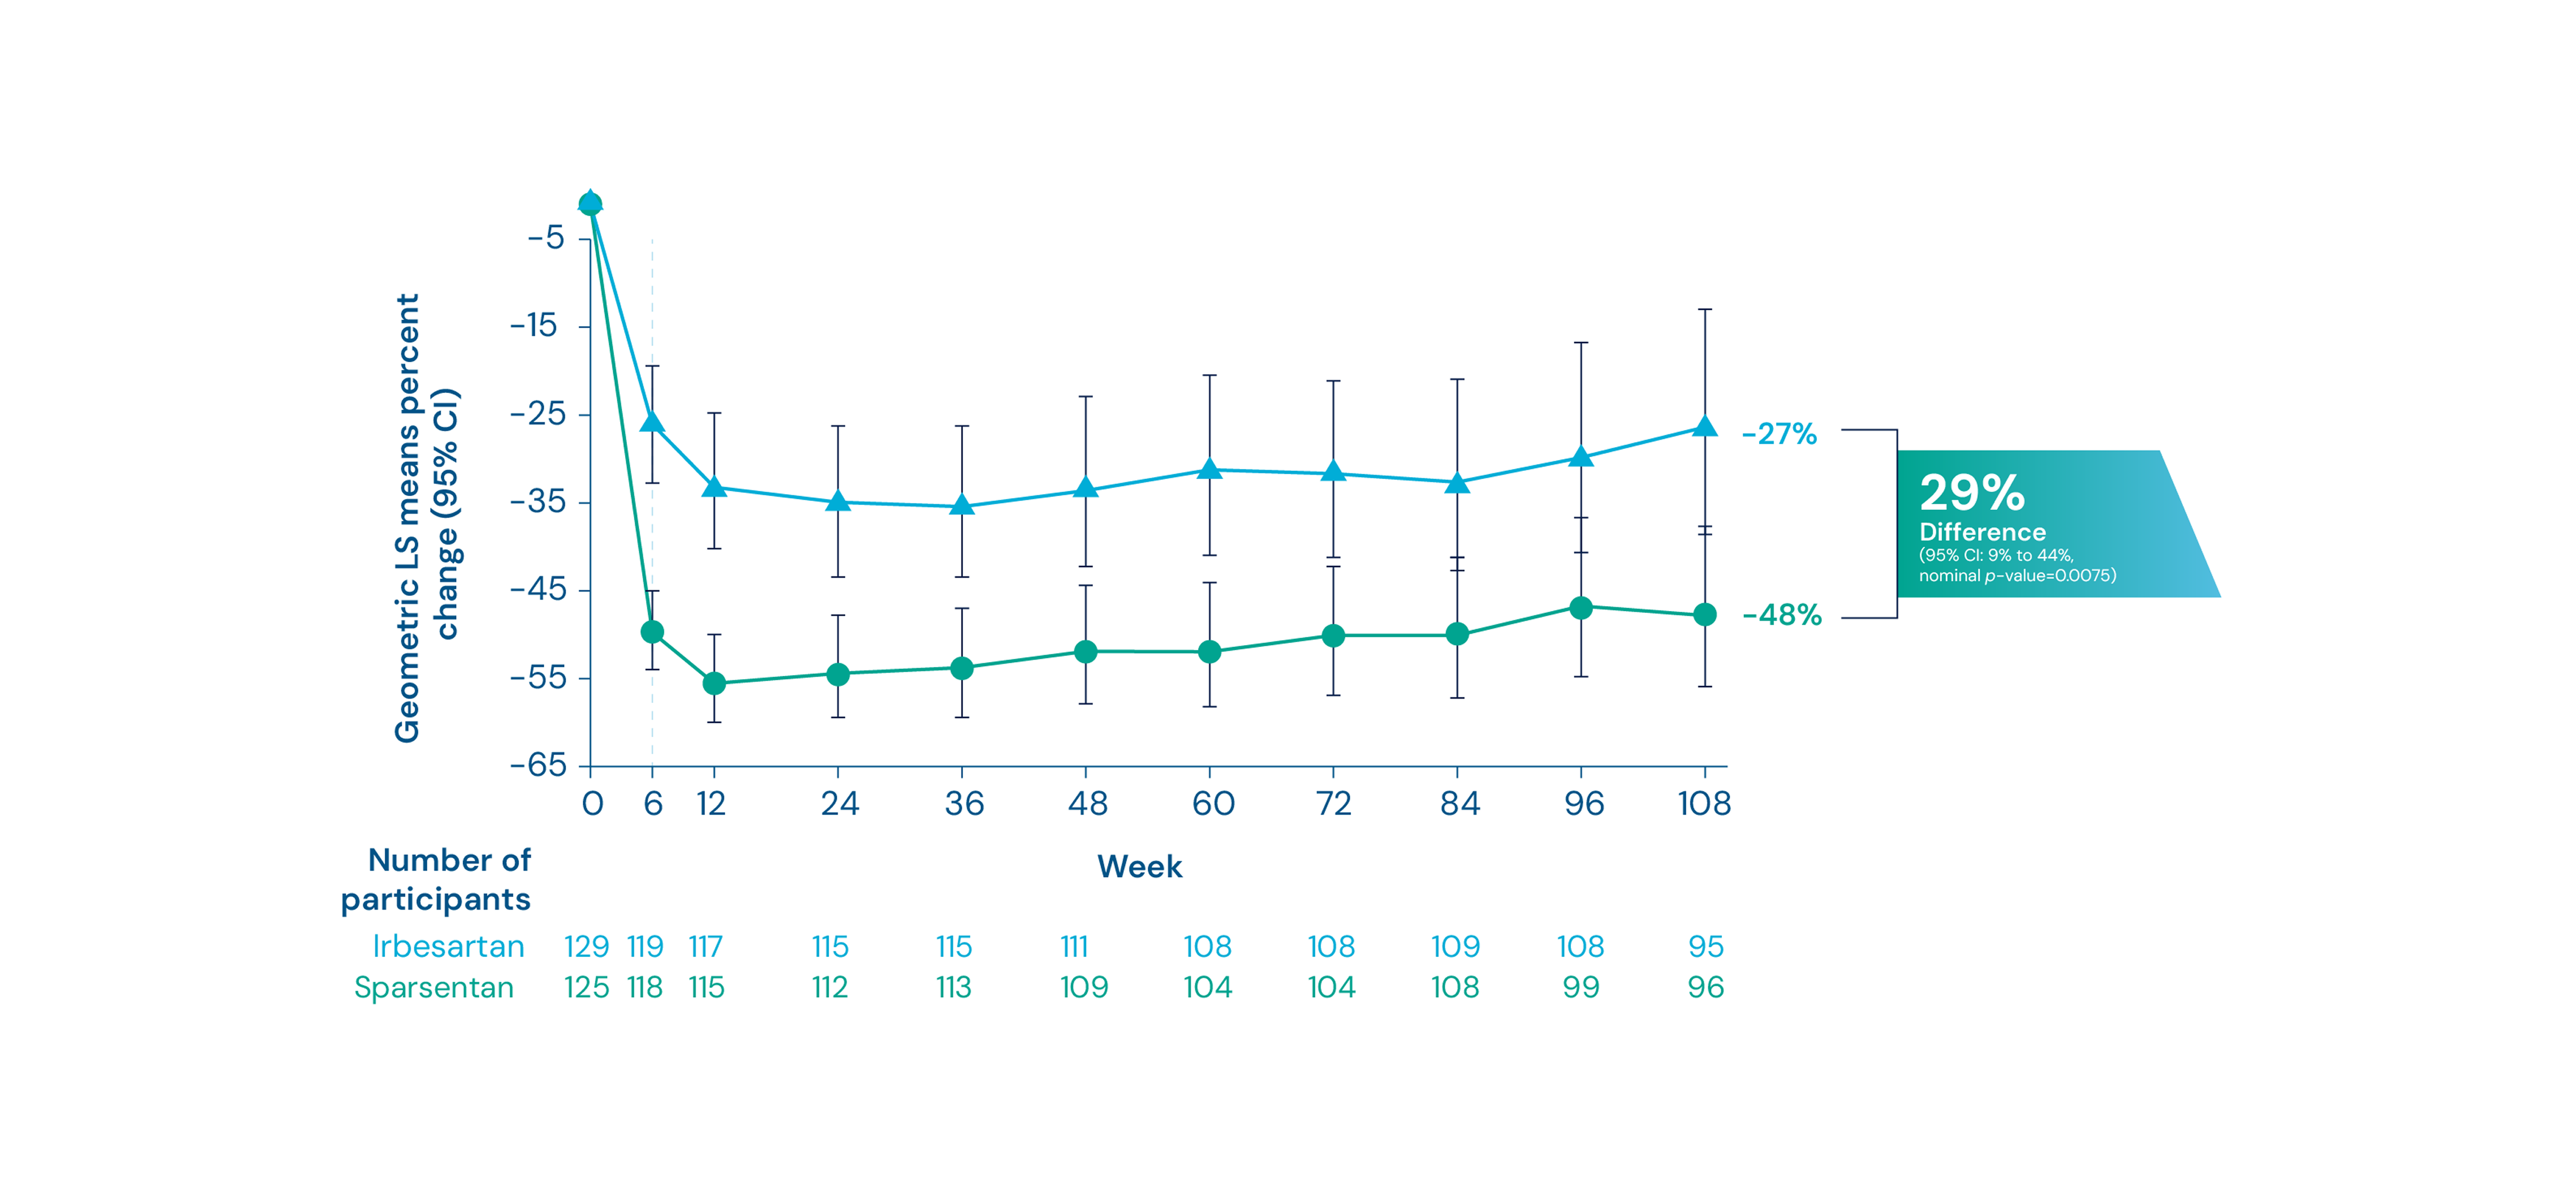
Summary
At 108 weeks, there was a mean reduction of proteinuria of 48% from baseline in patients receiving sparsentan vs. 27% in those receiving irbesartan (Difference: 29%, nominal p-value=0.0075) 4, 5, 14
Footnotes
*Nephrotic syndrome includes documentation of nephrotic syndrome in the medical history or the presence of three concurrent criteria: proteinuria greater than 3.5 g/24h (adults) or UPCR >2.0 g/g (pediatric patients <18 years of age), serum albumin <3.0 g/dL, and edema. 4 †Missing data were handled using multiple imputation. Patients who had initiated renal replacement therapy or died were sampled from the worst 5% of the observed proteinuria data. Changes from baseline in log UPCR were analyzed using the mixed models repeated model including treatment, baseline logarithm of UPCR, visit weeks stratification factors, interaction of visit weeks and treatment as factors.4
Proteinuria thresholds <0.3, <0.7, and <1.5 g/g
Without nephrotic syndrome subgroup analysis*
Proportion of patients who achieved UPCR <0.3, <0.7, and <1.5 g/g 14*,†
Summary
More patients in the sparsentan group achieved complete remission of proteinuria (UPCR of <0.3 g/g) and UPCR levels <0.7 g/g and <1.5 g/g compared to the irbesartan group 14
Footnotes
*Nephrotic syndrome includes documentation of nephrotic syndrome in the medical history or the presence of three concurrent criteria: proteinuria greater than 3.5 g/24h (adults) or UPCR >2.0 g/g (pediatric patients <18 years of age), serum albumin <3.0 g/dL, and edema.4 † At any time during the double-blind period. Percentages are based on all patients in the full analysis set within each group.14
Estimated eGFR chronic slope or total slope
Without nephrotic syndrome subgroup analysis*
Chronic slope 14
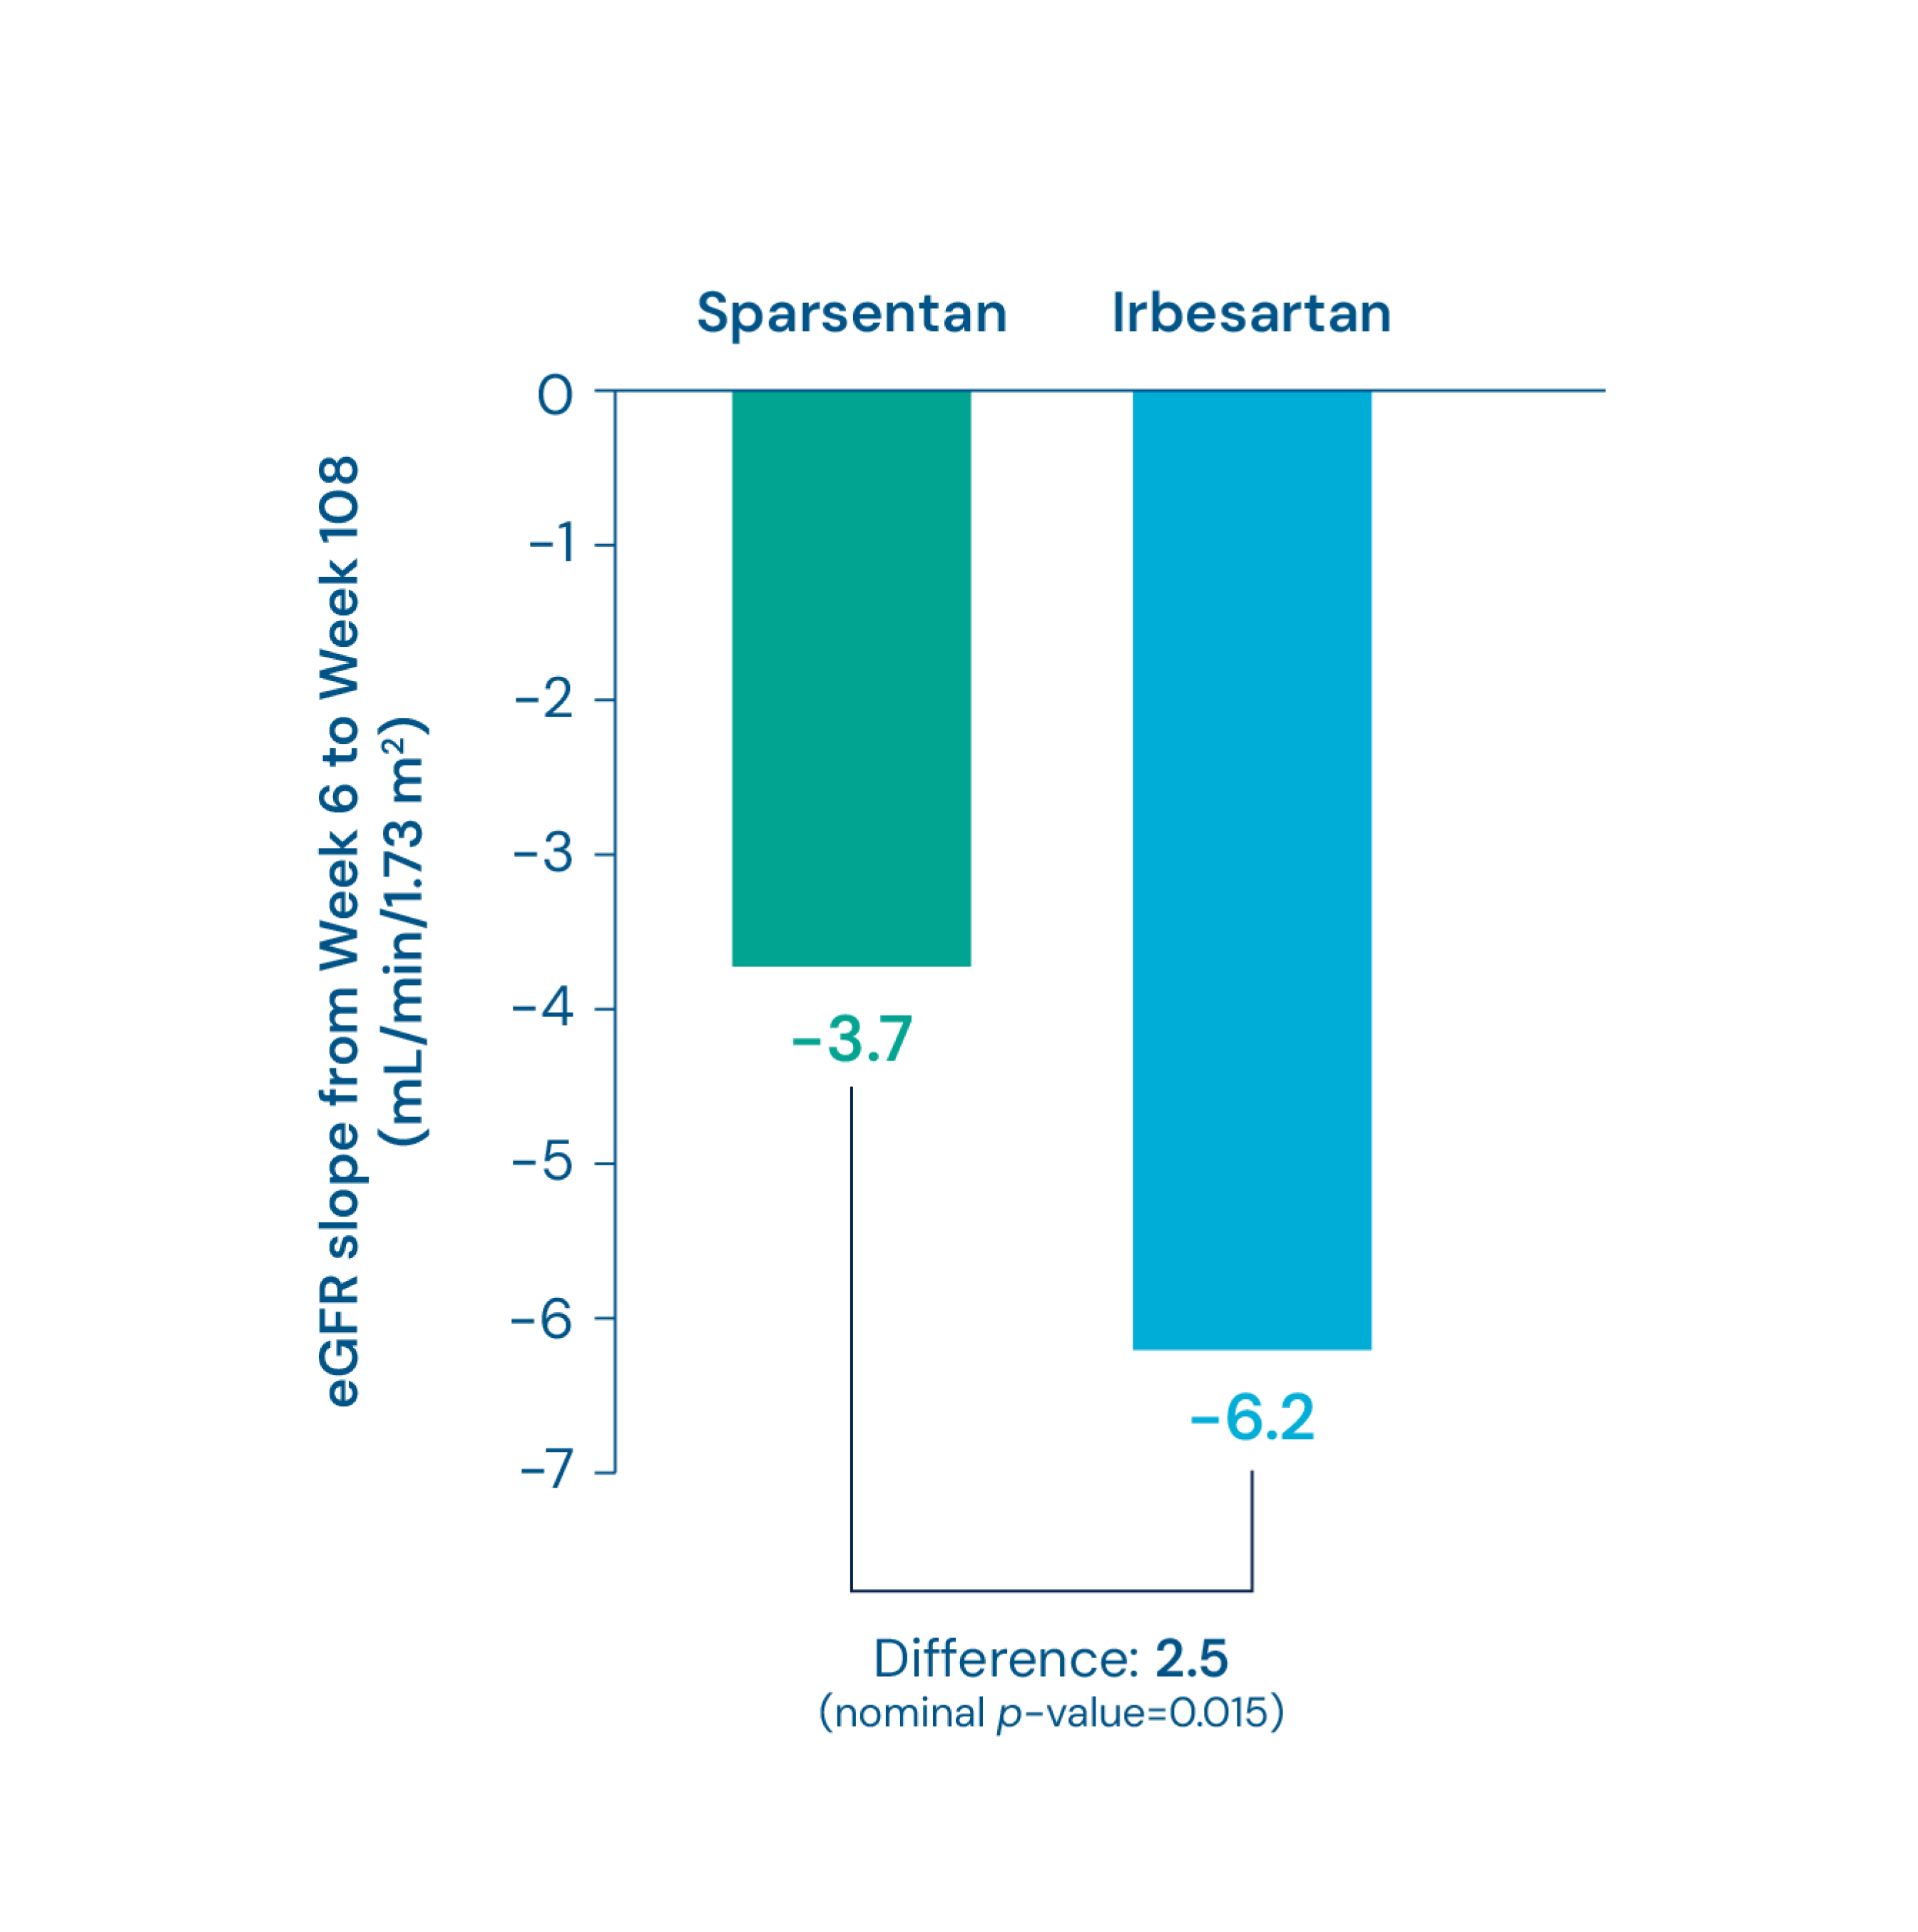
Total slope 14
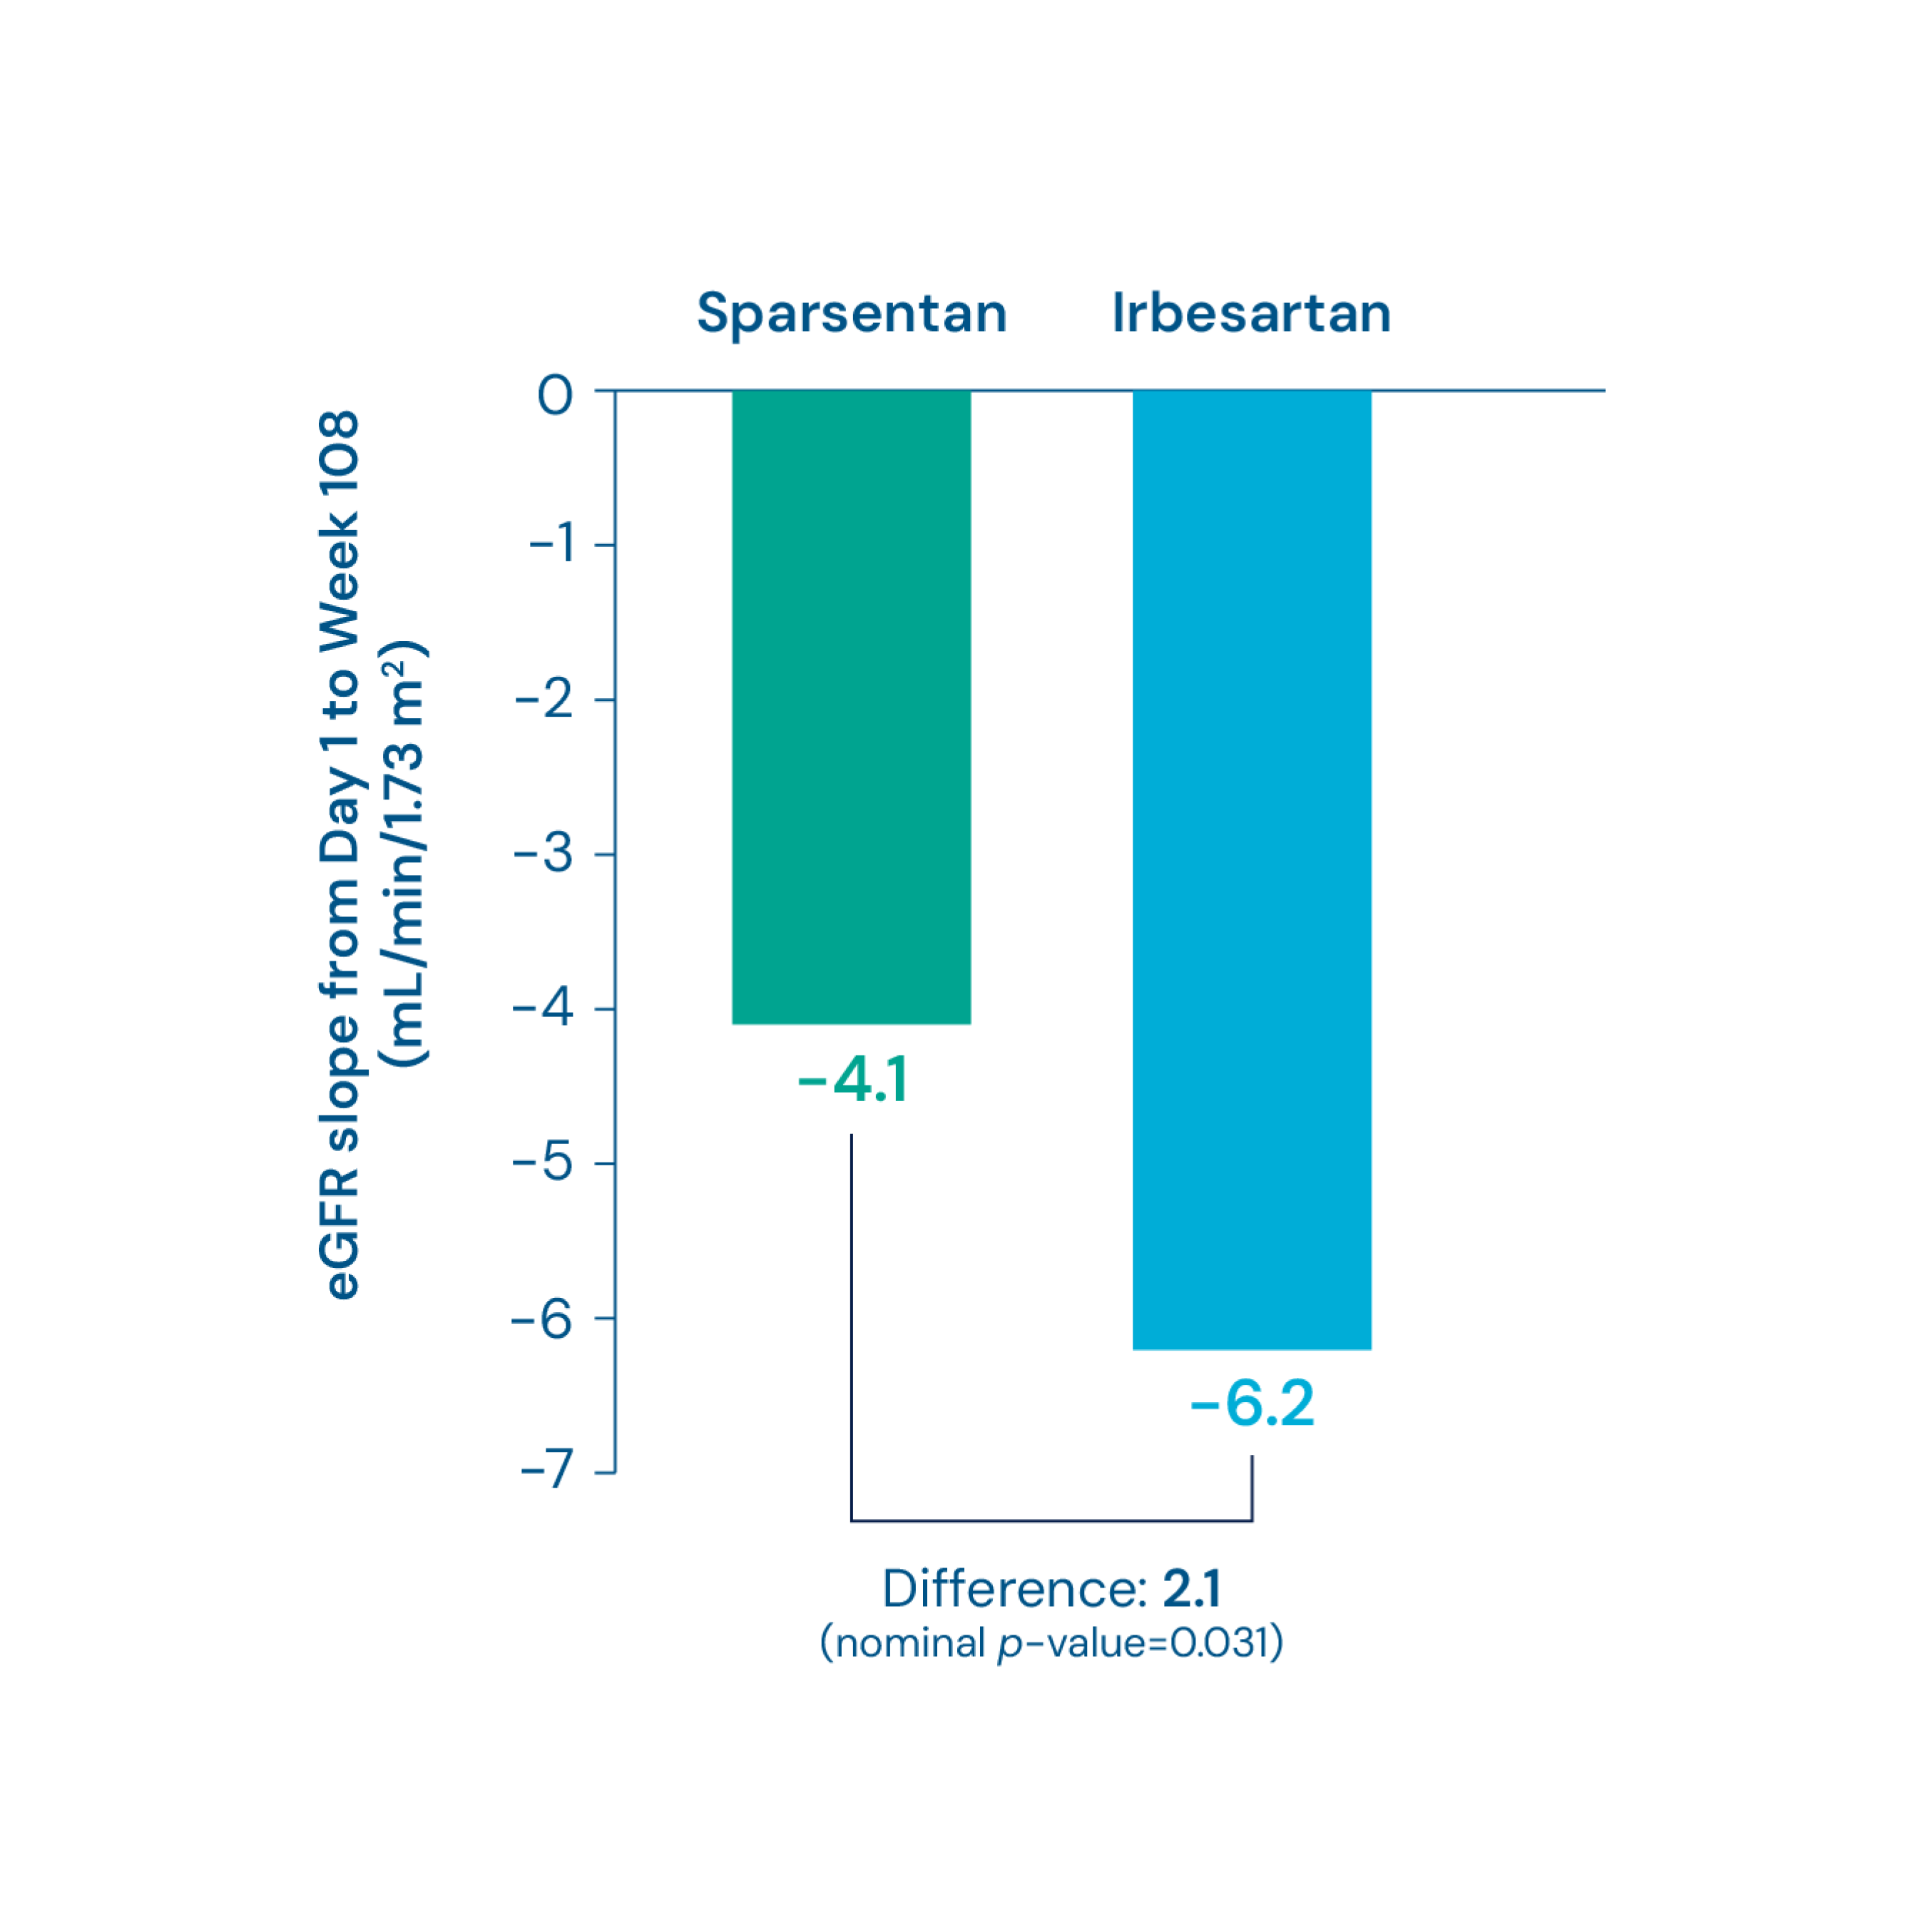
Summary
-
Differences in eGFR slopes were statistically significant between the sparsentan group versus the irbesartan group (mL/min/1.73 m2)
14
- Chronic slope (sparsentan vs. irbesartan): -3.7 vs. -6.2 (Difference: 2.5, nominal p-value=0.015) 14
- Total slope (sparsentan vs. irbesartan): -4.1 vs. -6.2 (Difference: 2.1, nominal p-value=0.031) 14
Footnotes
Kidney function (eGFR) at Week 108
Without nephrotic syndrome subgroup analysis*
Change in eGFR from baseline to Week 108 4
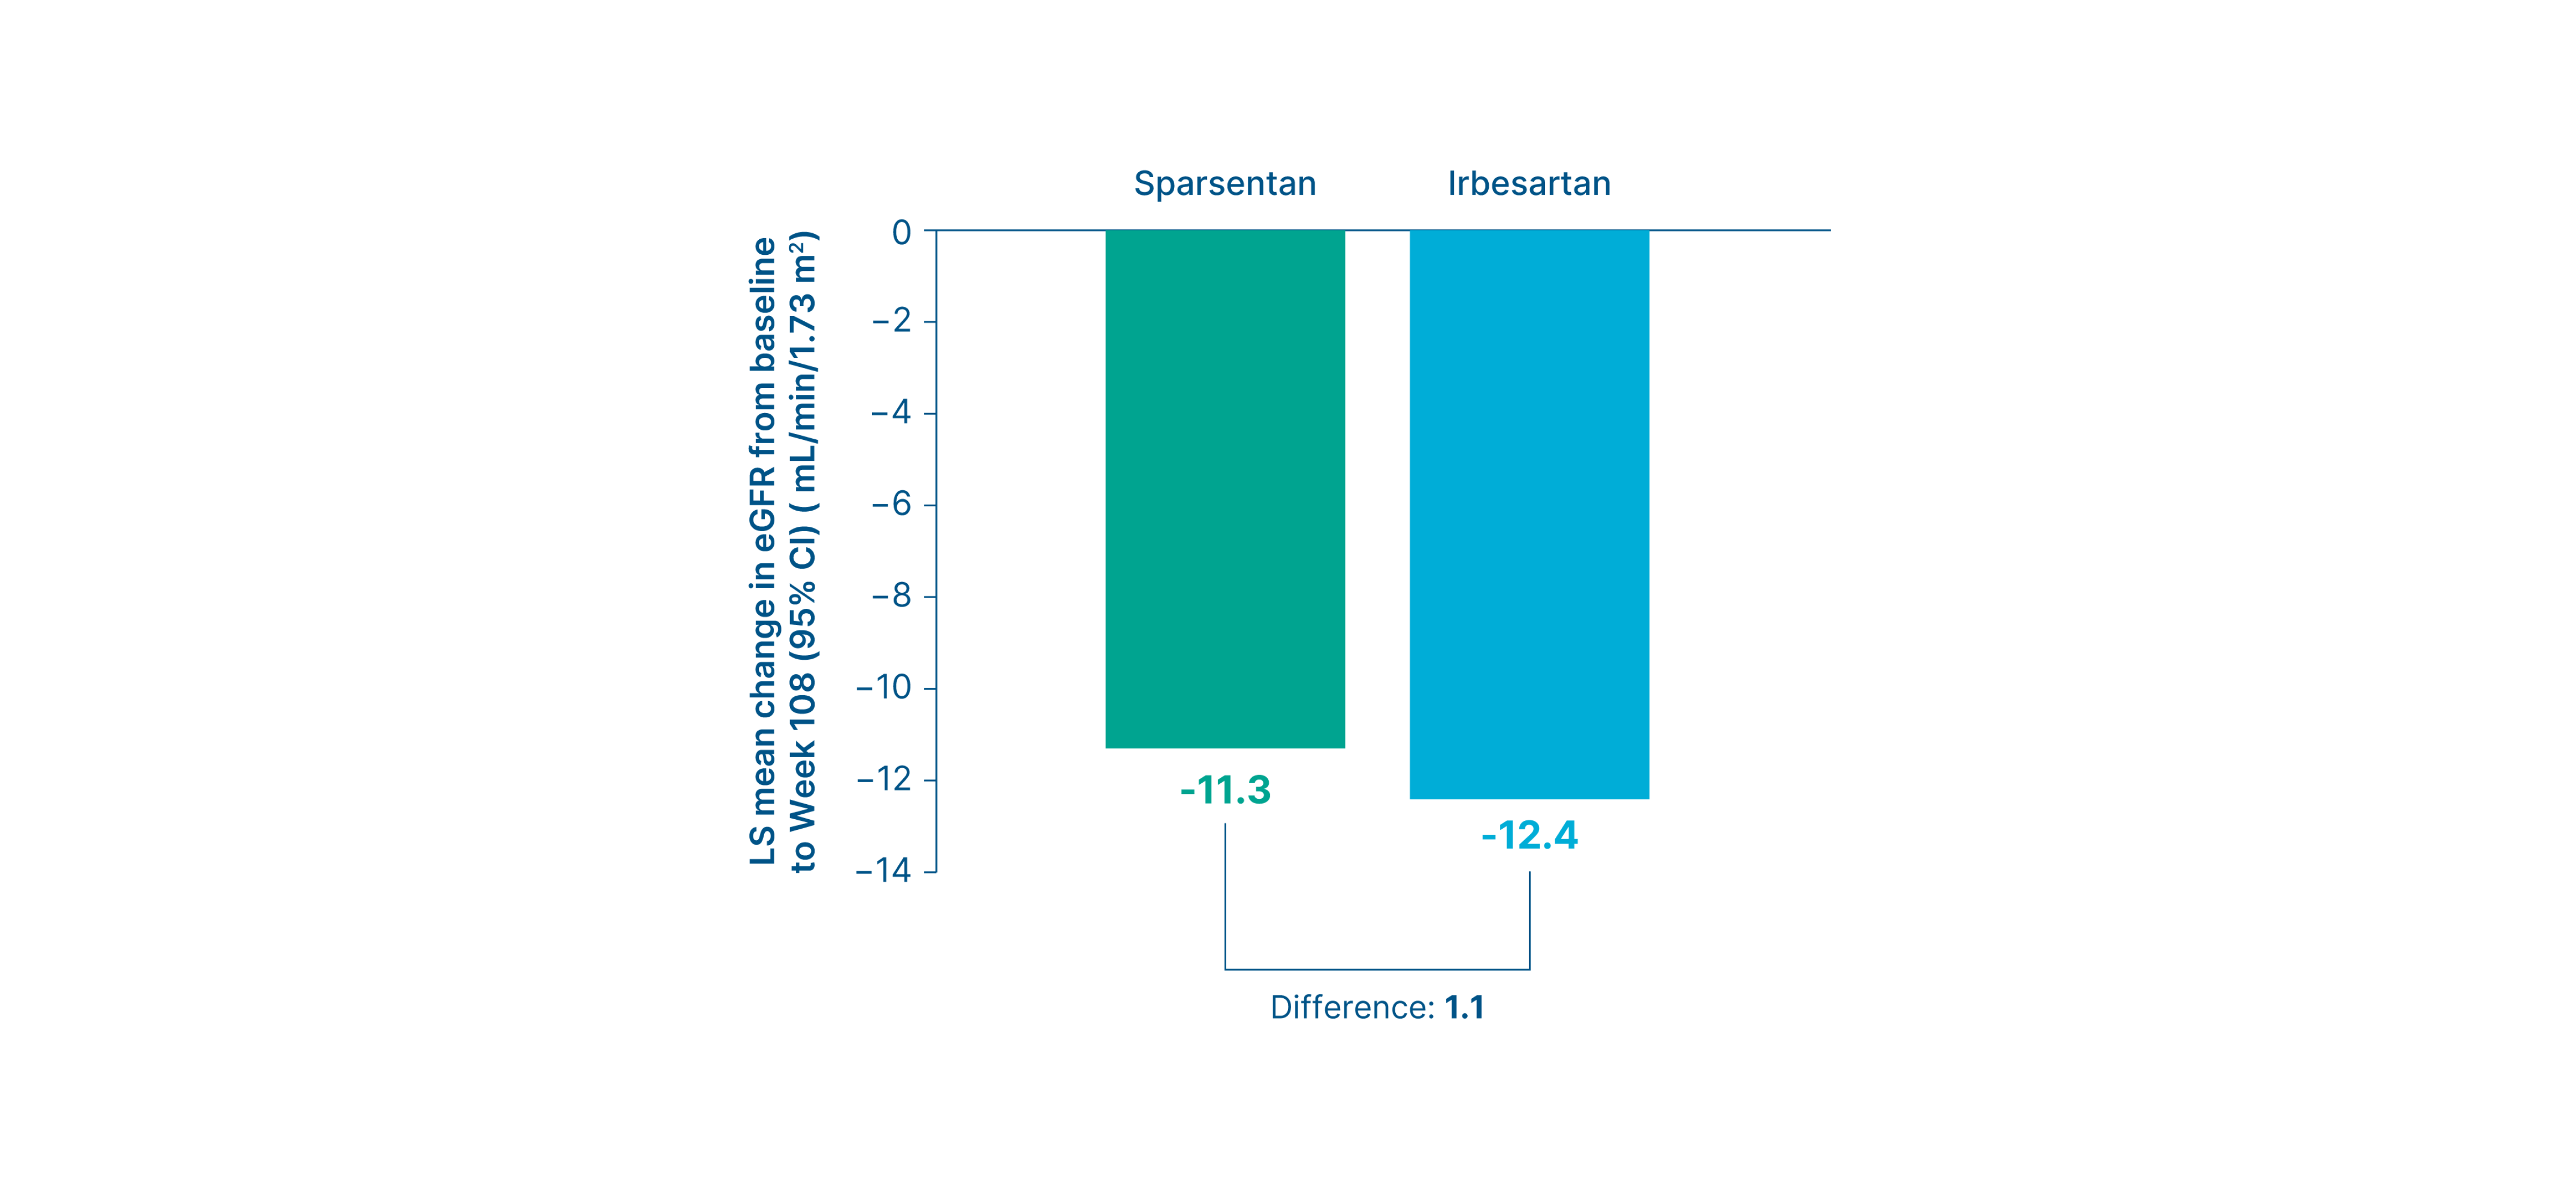
Summary
-
At Week 108, there was a smaller mean change from baseline in eGFR with sparsentan vs. irbesartan (mL/min/1.73 m2)
4
- Sparsentan vs. irbesartan: -11.3 vs. -12.4 (Difference: 1.1, 95% CI: -2.6 to 4.8) 4
Footnotes
*Nephrotic syndrome includes documentation of nephrotic syndrome in the medical history or the presence of three concurrent criteria: proteinuria greater than 3.5 g/24h (adults) or UPCR >2.0 g/g (pediatric patients <18 years of age), serum albumin <3.0 g/dL, and edema. 4
Kidney failure outcome
Without nephrotic syndrome subgroup analysis*
Proportion of patients who reached kidney failure 14

Summary
- Fewer patients in the sparsentan group reached kidney failure compared to the irbesartan group (1.6% vs 8.0%, Relative risk: 0.19, nominal p-value=0.0180) 14
- Nominal p-values for odds ratio for rates of no event
Footnotes
*Nephrotic syndrome includes documentation of nephrotic syndrome in the medical history or the presence of three concurrent criteria: proteinuria greater than 3.5 g/24h (adults) or UPCR >2.0 g/g (pediatric patients <18 years of age), serum albumin <3.0 g/dL, and edema. 4
Proteinuria (UPCR) at Week 108
Pediatric subgroup analysis
Change in UPCR from baseline up to Week 108 8
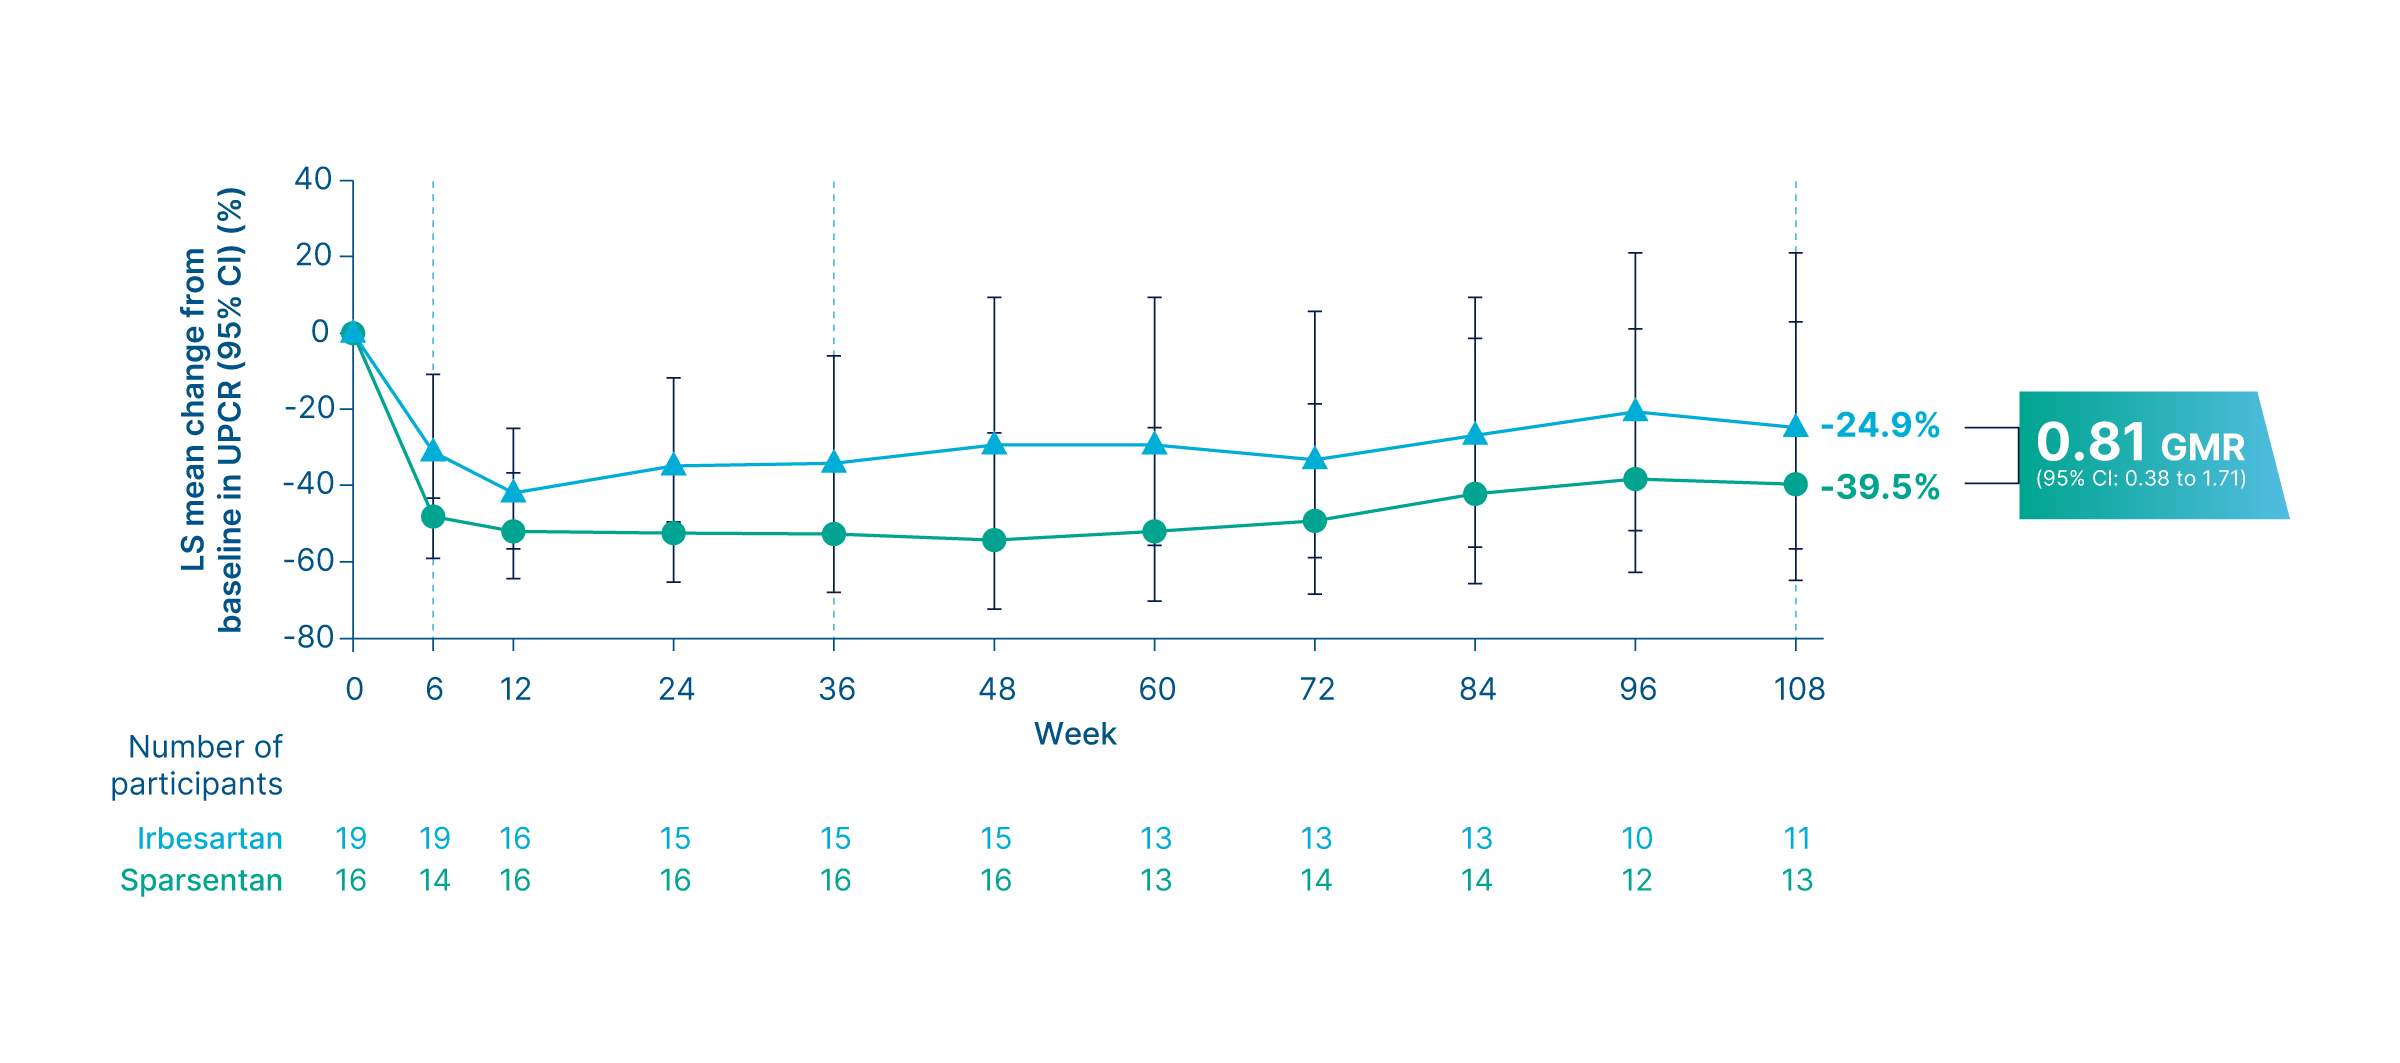
Summary
-
There was a mean reduction of proteinuria of 39.5% from baseline in patients receiving sparsentan vs. 24.9% in those receiving irbesartan
8
- The geometric LS mean ratio was 0.81 (95% CI: 0.38 to 1.71) 8
- Reductions in UPCR were observed as early as Week 6 and sustained through Week 108 in the sparsentan arm 8
Proteinuria thresholds <0.3, <0.5, and <1.0 g/g and FSGS partial remission endpoint
Pediatric subgroup analysis
Proportion of patients who achieved low proteinuria thresholds 8
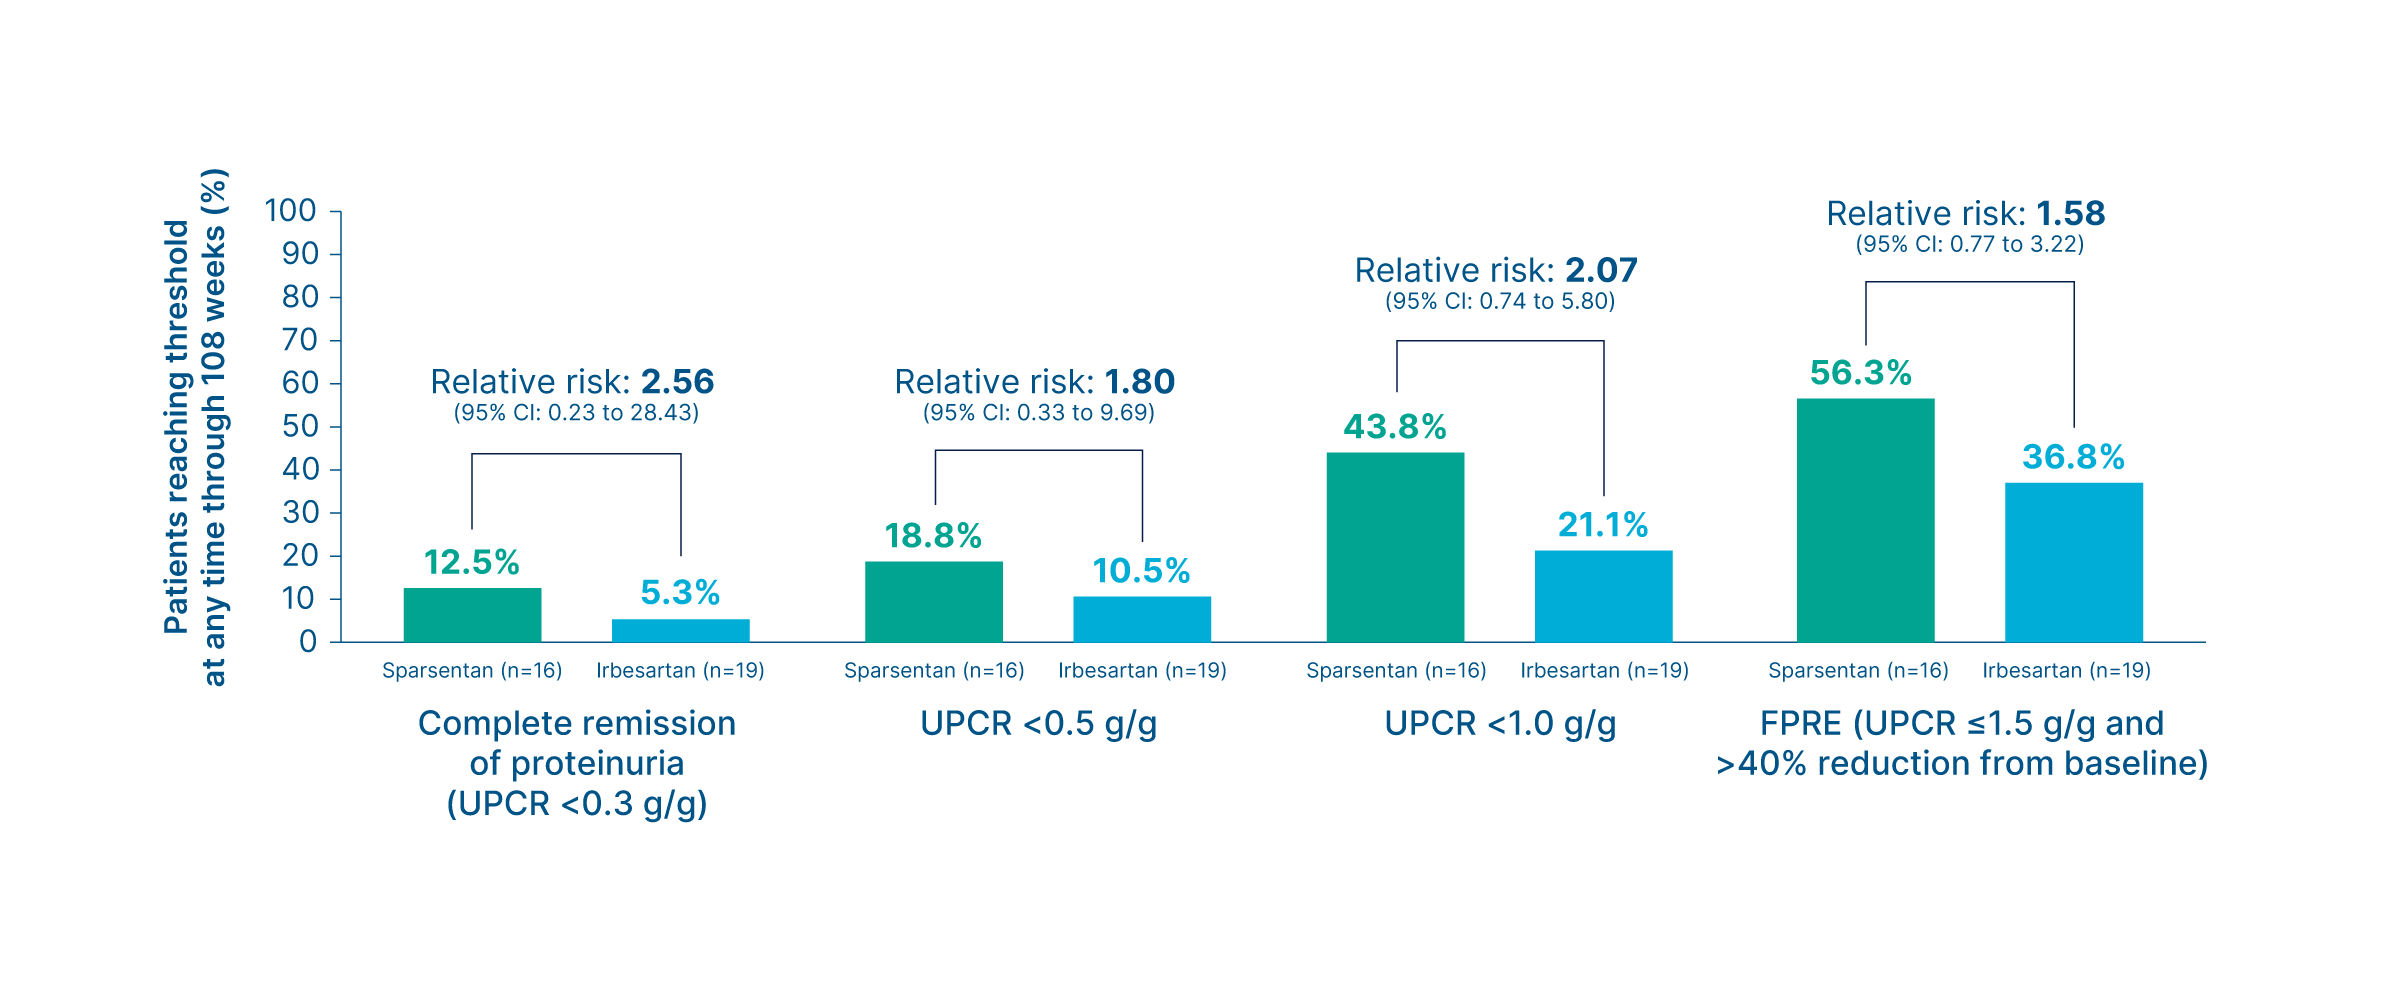
Summary
-
Higher proportions of patients in the sparsentan group consistently reached low proteinuria thresholds, including complete remission of proteinuria (UPCR <0.3 g/g), compared with the irbesartan group
8
- Complete remission of proteinuria (UPCR <0.3 g/g) (sparsentan vs. irbesartan): 12.5% vs. 5.3% (Relative risk: 2.56, 95% CI: 0.23 to 28.43) 8
- UPCR <0.5 g/g (sparsentan vs. irbesartan): 18.8% vs. 10.5% (Relative risk: 1.80, 95% CI: 0.33 to 9.69) 8
- UPCR <1.0 g/g (sparsentan vs. irbesartan): 43.8% vs. 21.1% (Relative risk: 2.07, 95% CI: 0.74 to 5.80) 8
- FPRE (UPCR ≤1.5 g/g and >40% reduction from baseline): 56.3% vs. 36.8% (Relative risk: 1.58, 95% CI: 0.77 to 3.22) 8
Composite kidney failure endpoint at Week 108
Pediatric subgroup analysis
Proportion of patients who reached the composite kidney failure endpoint 8

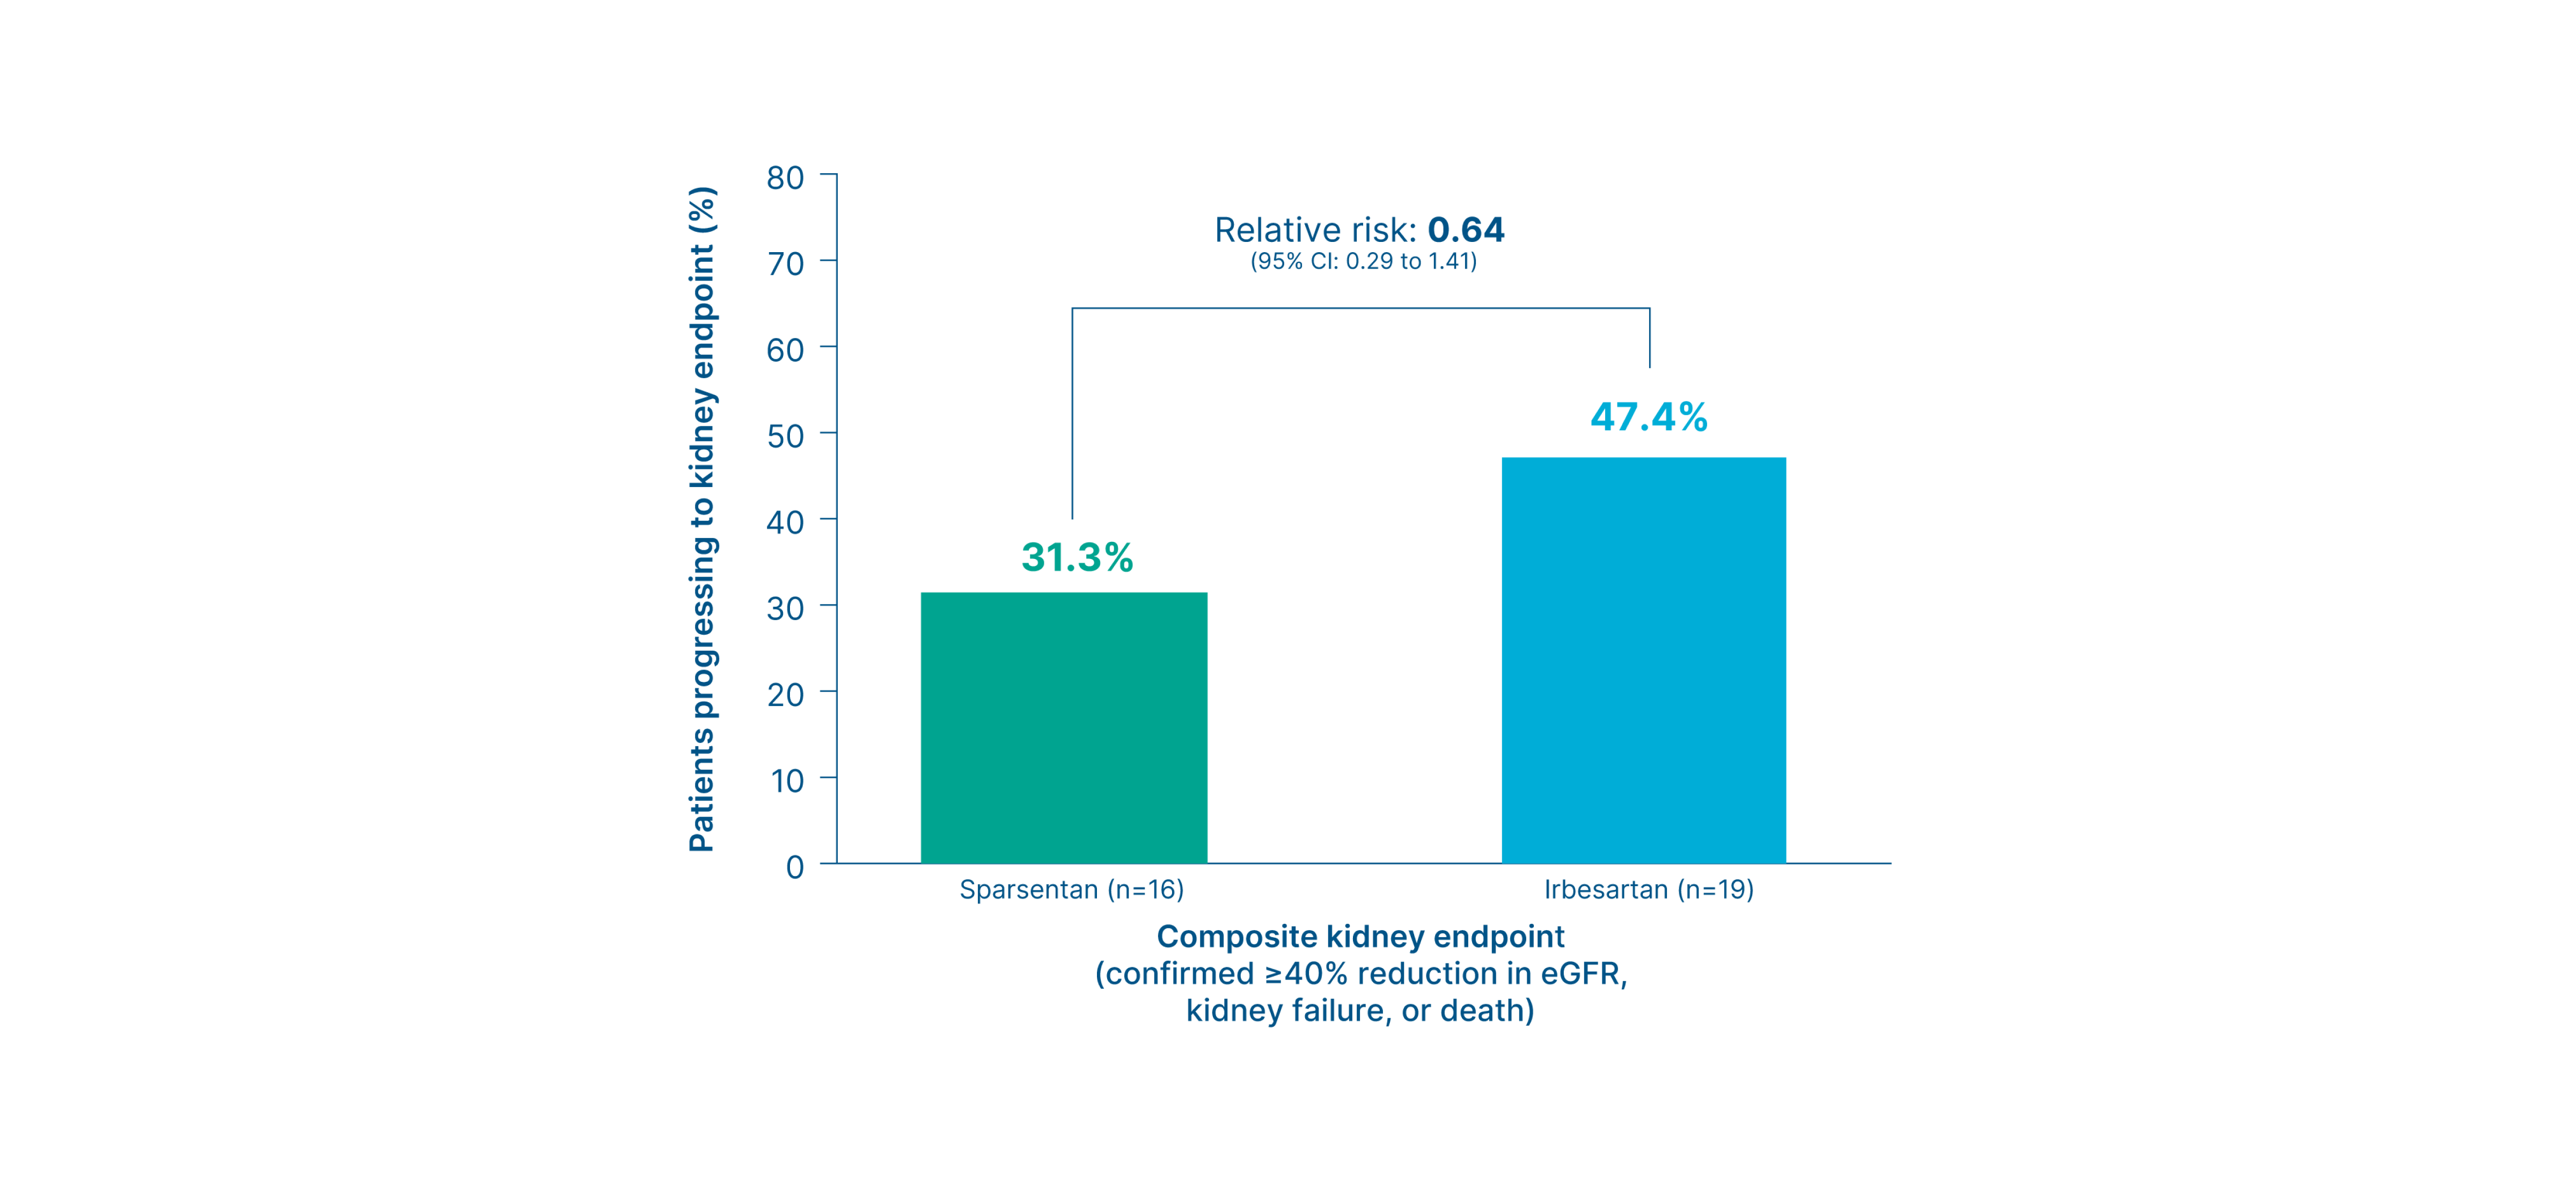
Summary
-
Fewer patients in the sparsentan group reached the composite kidney endpoint vs. the irbesartan group
8
- Sparsentan vs. irbesartan: 31.3% vs. 47.4% (Relative risk: 0.64, 95% CI: 0.29 to 1.41) 8
-
Fewer patients in the sparsentan group progressed to kidney failure vs. the irbesartan group
8
- Sparsentan vs. irbesartan: 12.5% vs. 36.8% (Relative risk: 0.31, 95% CI: 0.08 to 1.12) 8
Proteinuria (UPCR) at Week 108
Genetic-associated FSGS subgroup analysis - Podocyte gene variants
Change in UPCR from baseline up to Week 108 in patients with podocyte gene variants 9, 15
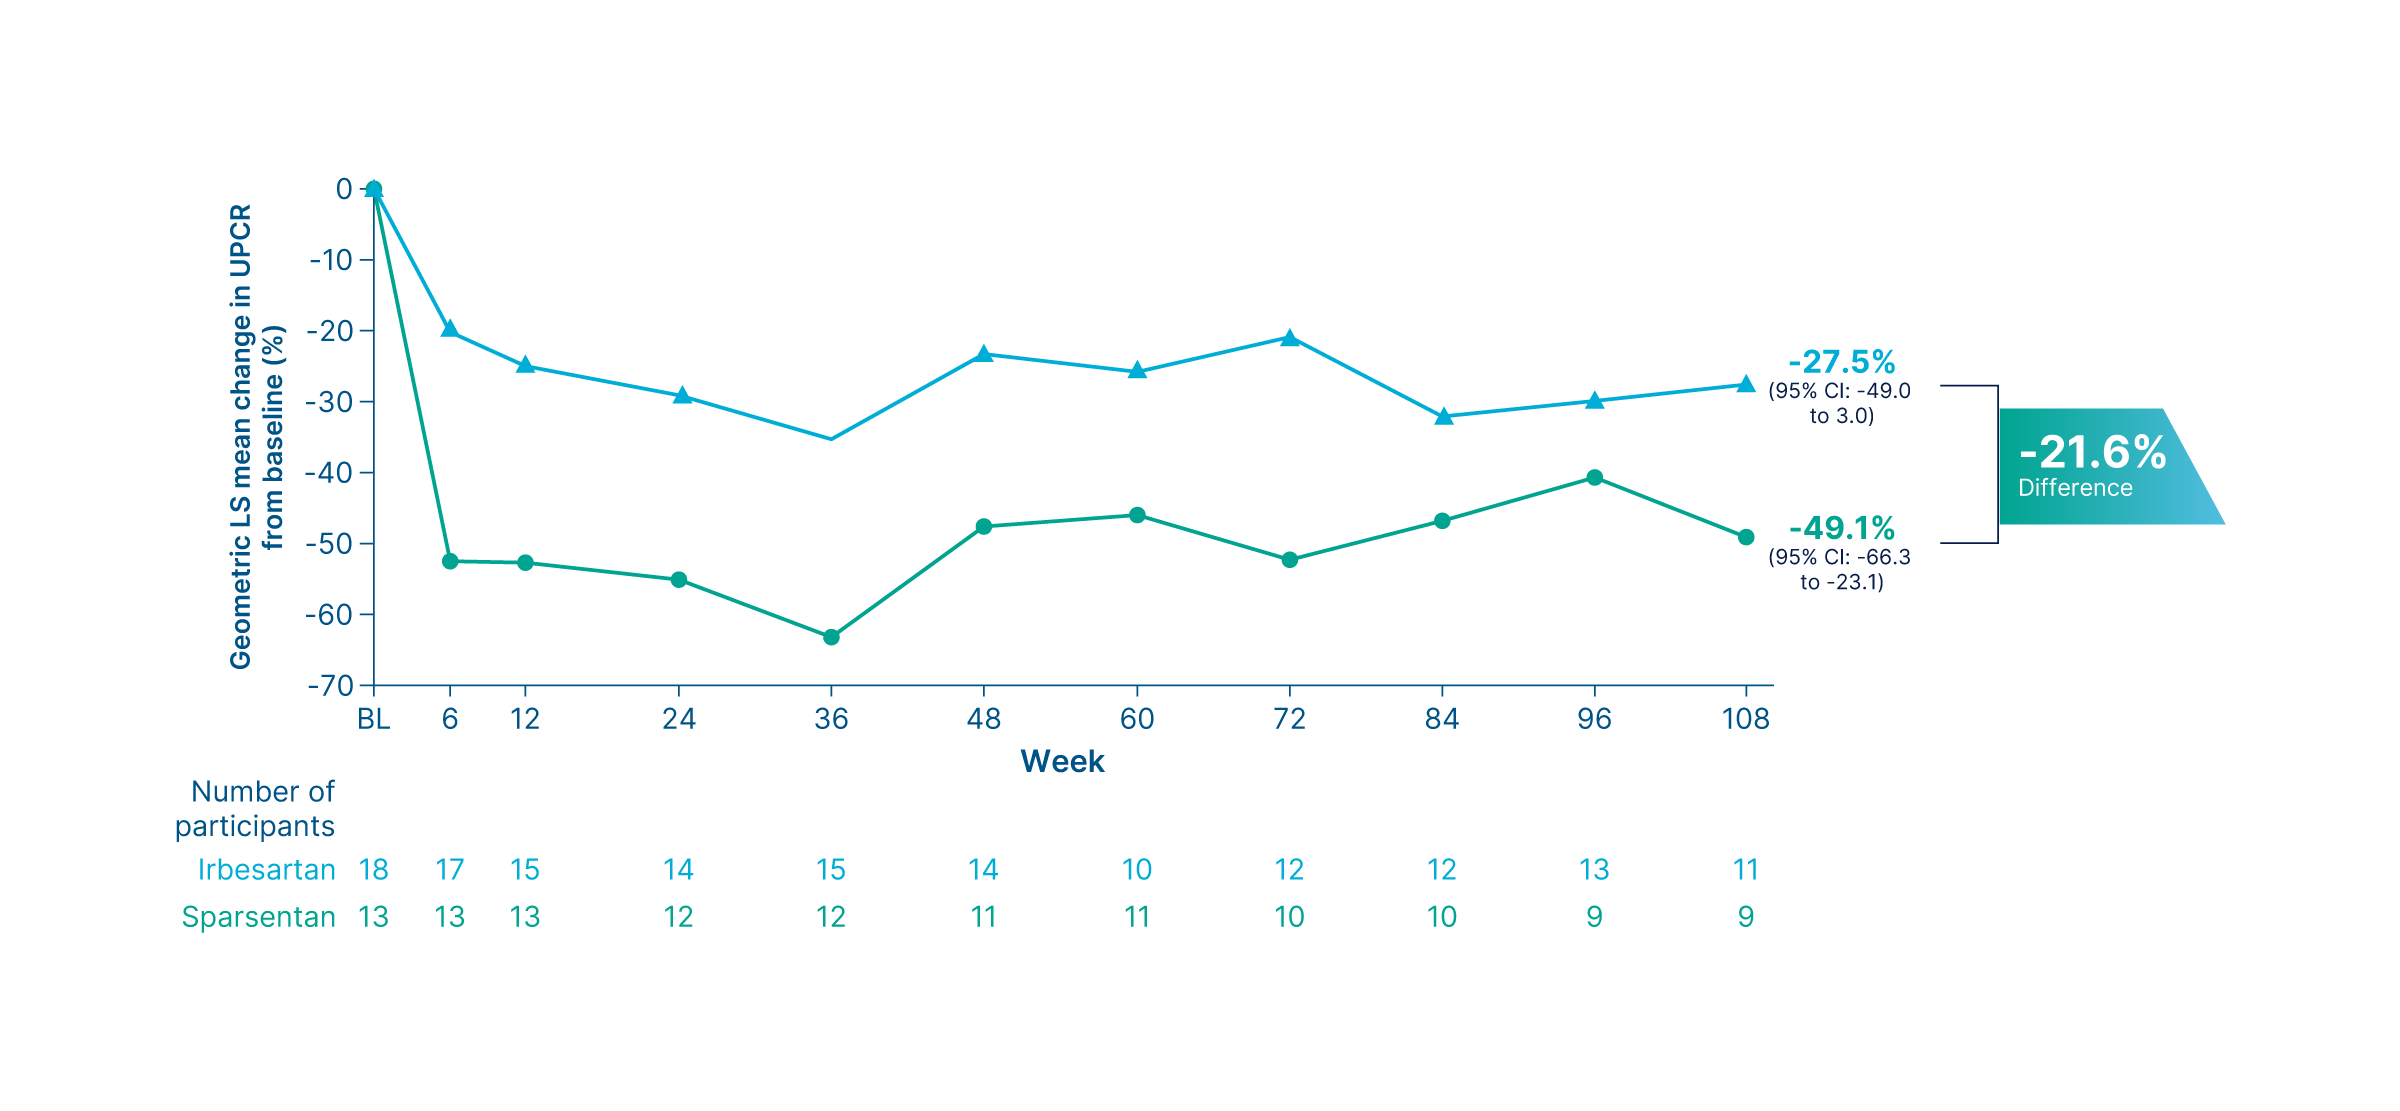
Summary
- As early as Week 6, sparsentan led to a greater reduction in proteinuria compared to irbesartan 9
- At Week 108, the geometric LS mean percent change from baseline in UPCR was -49.1% for sparsentan (95% CI: -66.3 to -23.1) vs. -27.5% for irbesartan (95% CI: -49.0 to 3.0) 15
Proteinuria (UPCR) at Week 108
Genetic-associated FSGS subgroup analysis - COL4A3-5 variants
Change in UPCR from baseline up to Week 108 in patients with COL4A3-5 variants 9, 15
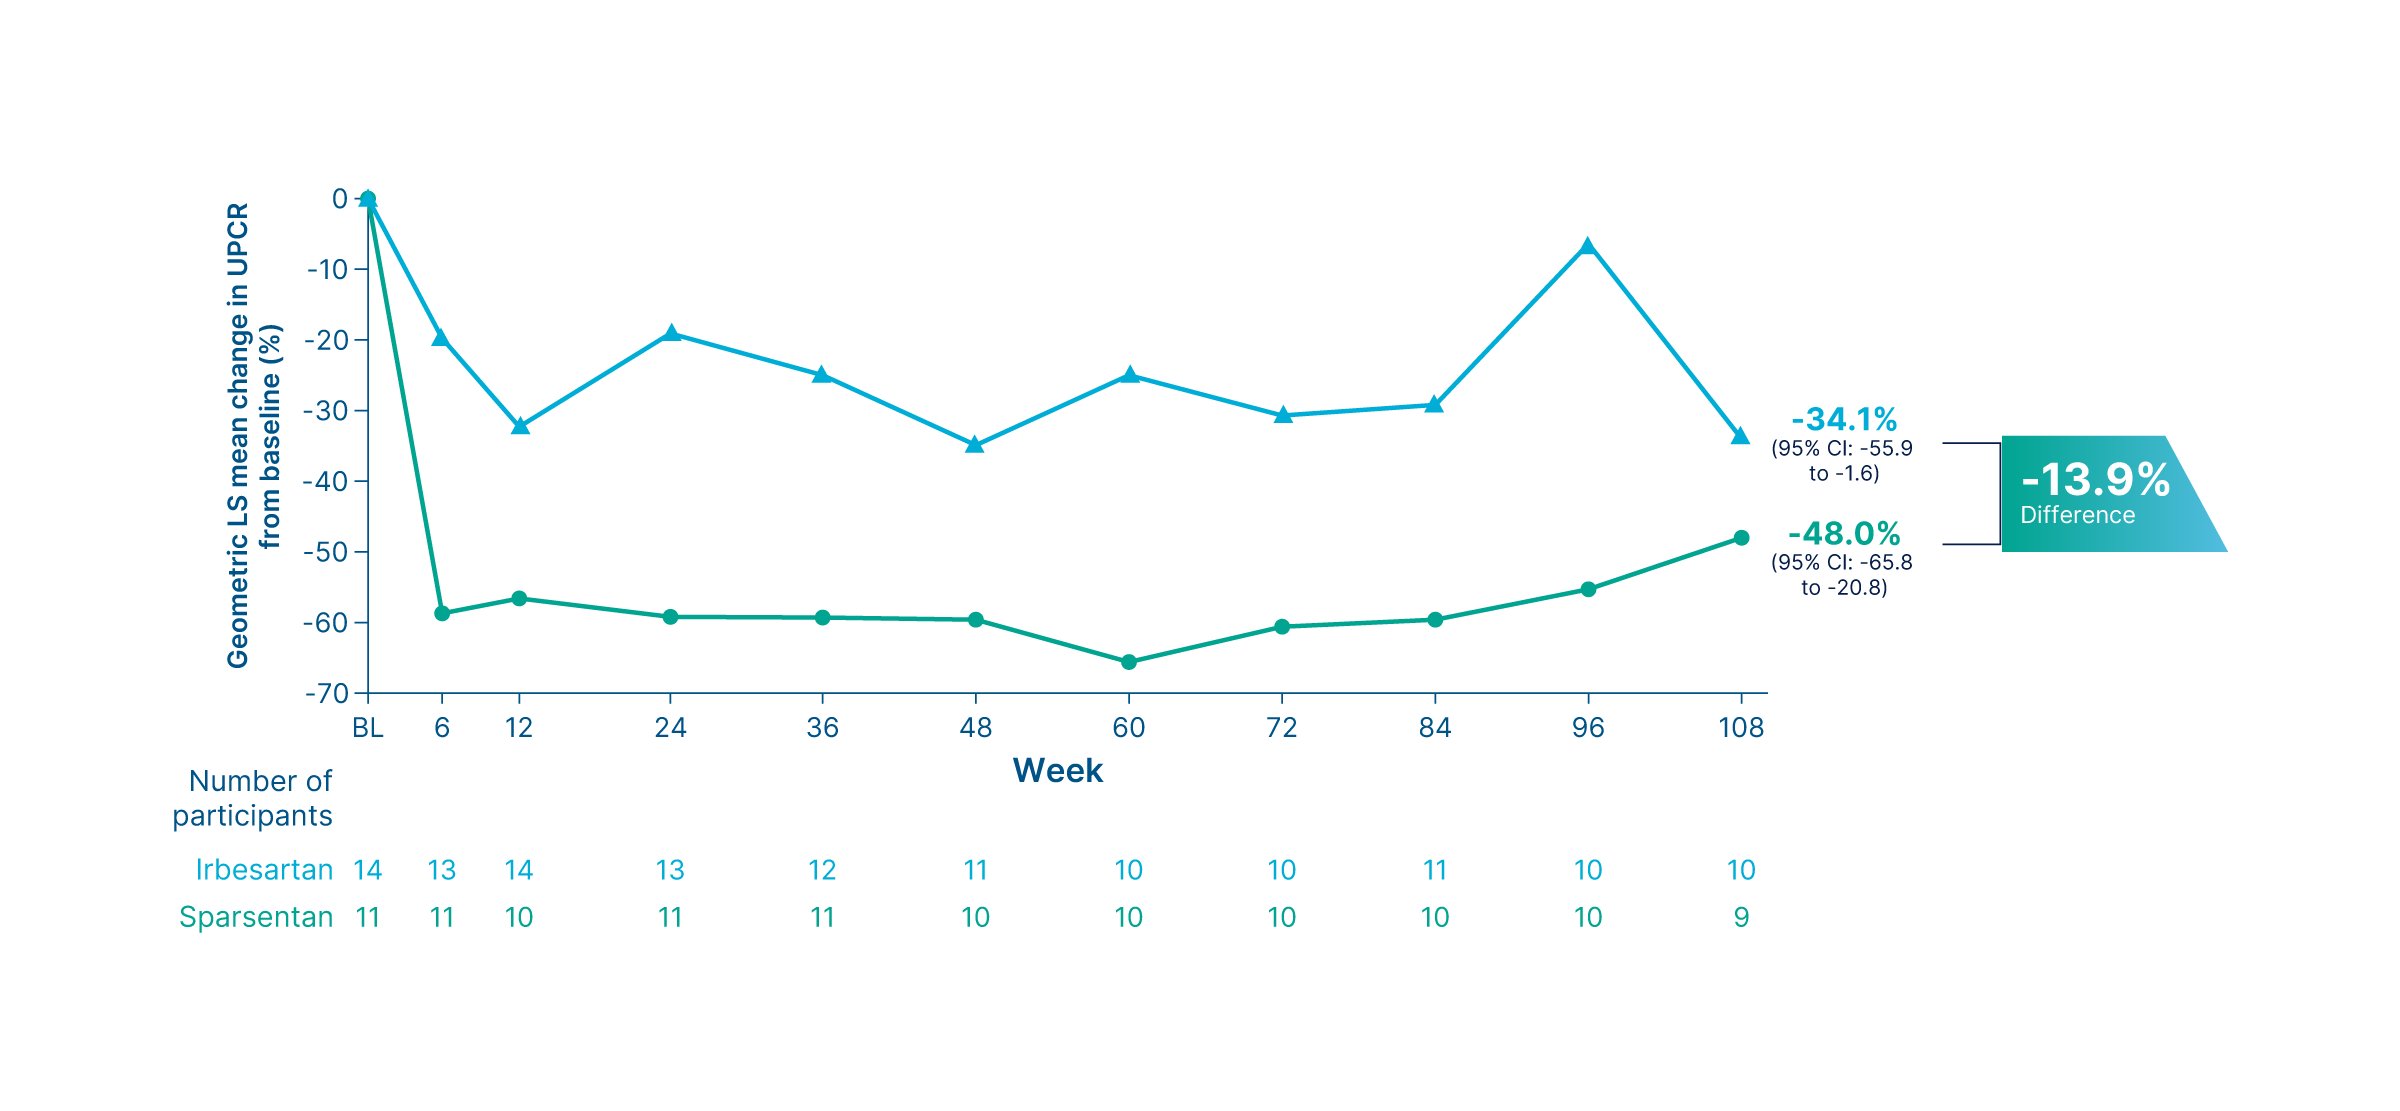
Summary
- As early as Week 6, sparsentan led to a greater reduction in proteinuria compared to irbesartan 9
- At Week 108, the geometric LS mean percent change from baseline in UPCR was -48.0% for sparsentan (95% CI: -65.8 to -20.8) vs. -34.1% for irbesartan (95% CI: -55.9 to –1.6) 15
Proteinuria (UPCR) at Week 108
Genetic-associated FSGS subgroup analysis - APOL1 high-risk genotypes
Change in UPCR from baseline up to Week 108 in patients with APOL1 high-risk genotypes 9, 15
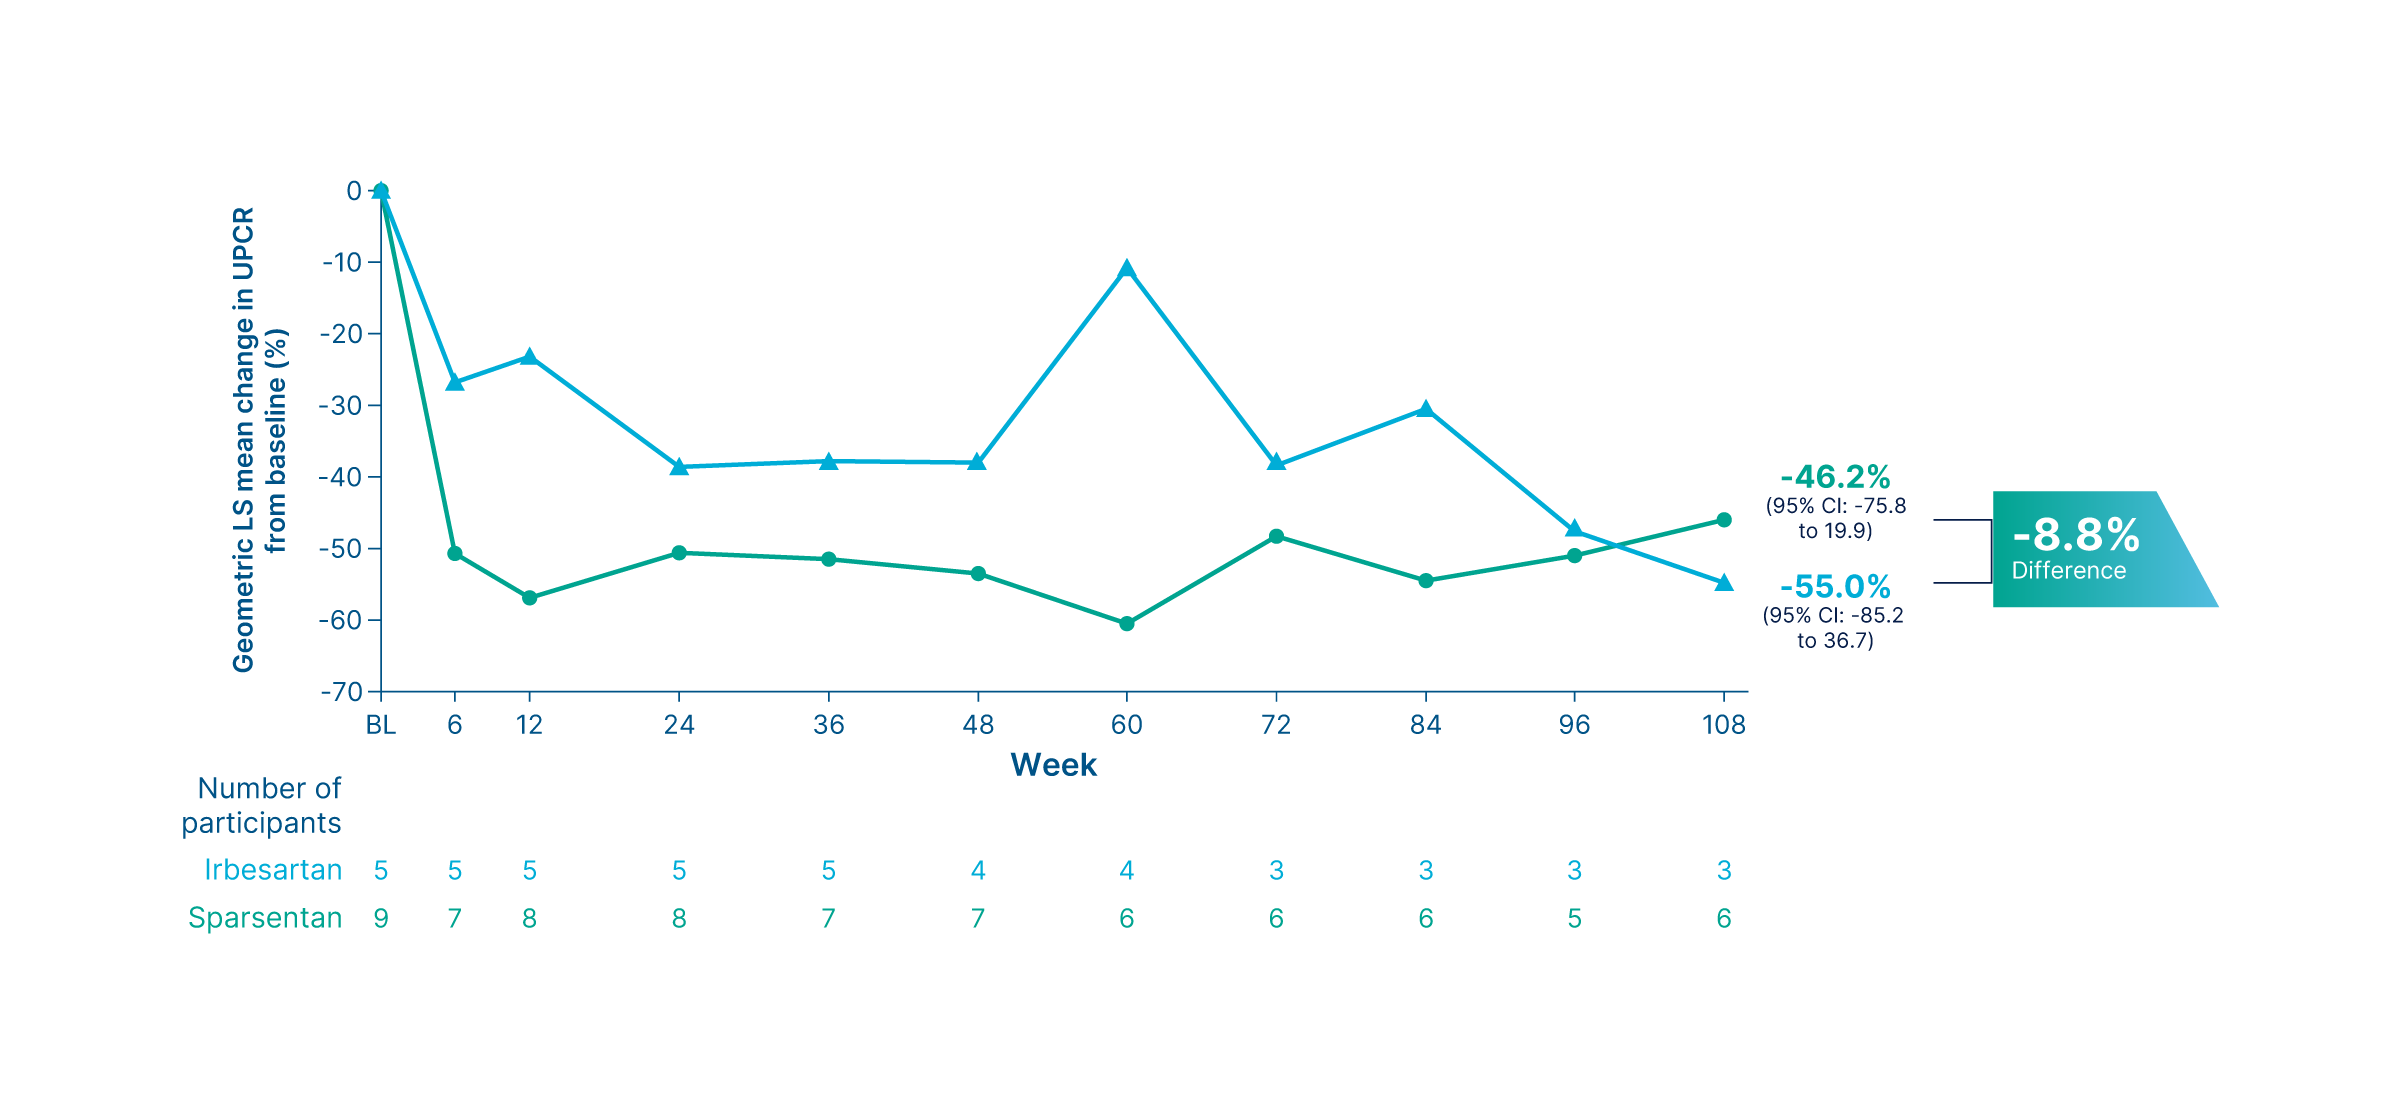
Summary
- As early as Week 6, sparsentan led to a greater reduction in proteinuria compared to irbesartan 9
- At Week 108, the geometric LS mean percent change from baseline in UPCR was –46.2% for sparsentan (95% CI: –75.8 to 19.9) vs. –55.0% for irbesartan (95% CI: –85.2 to 36.7) 15
Time-weighted proteinuria (UPCR) at Week 108
Genetic-associated FSGS subgroup analysis
Time-weighted UPCR change from baseline by genetic and treatment groups 9
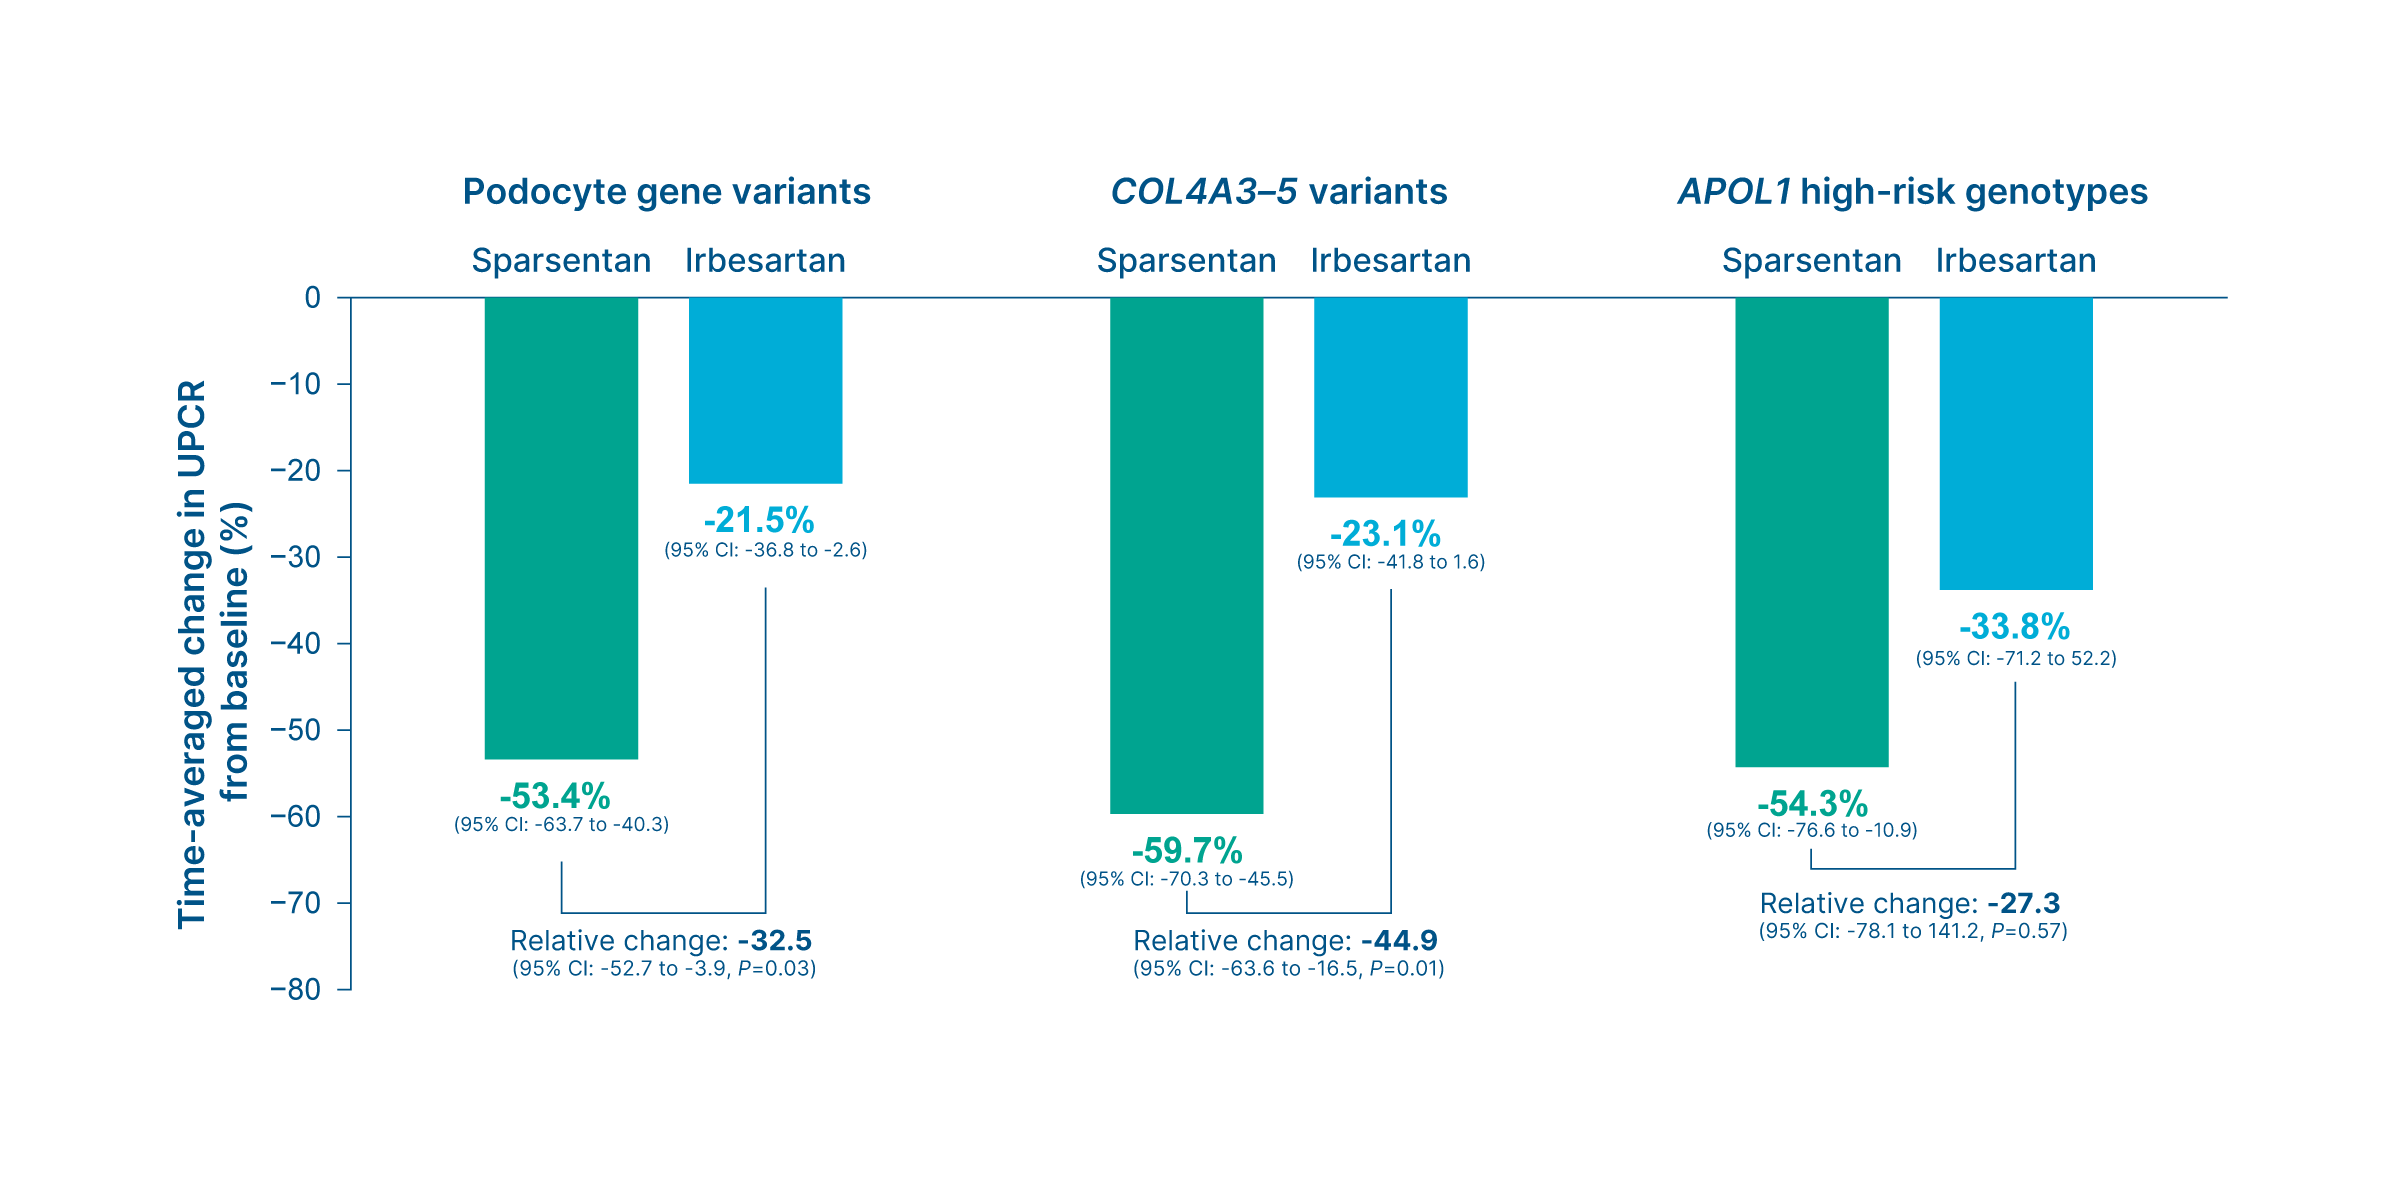
Summary
- Compared to irbesartan, sparsentan demonstrated a significant reduction in time-weighted UPCR change from baseline in patients with podocyte gene variants and COL4A3-5 variants 9
- Podocyte gene variants (sparsentan vs. irbesartan): -53.4% vs. -21.5% (Relative change: -32.5 (95% CI: -52.7 to -3.9, P=0.03) 9
- COL4A3-5 variants (sparsentan vs. irbesartan): -59.7% vs. -23.1% (Relative change: -44.9 (95% CI: -63.6 to -16.5, P=0.01) 9
- The reduction in time-weighted UPCR change from baseline was non-significant in patients with APOL1 high-risk genotypes (Sparsentan: -54.3% vs. Irbesartan: -33.8%, Relative change: -27.3 (95% CI: -78.1 to 141.2, P=0.57) 9
Complete remission of proteinuria
Genetic-associated FSGS subgroup analysis
Proportion of patients with genetic-associated FSGS who reached complete remission of proteinuria (UPCR <0.3 g/g) 9
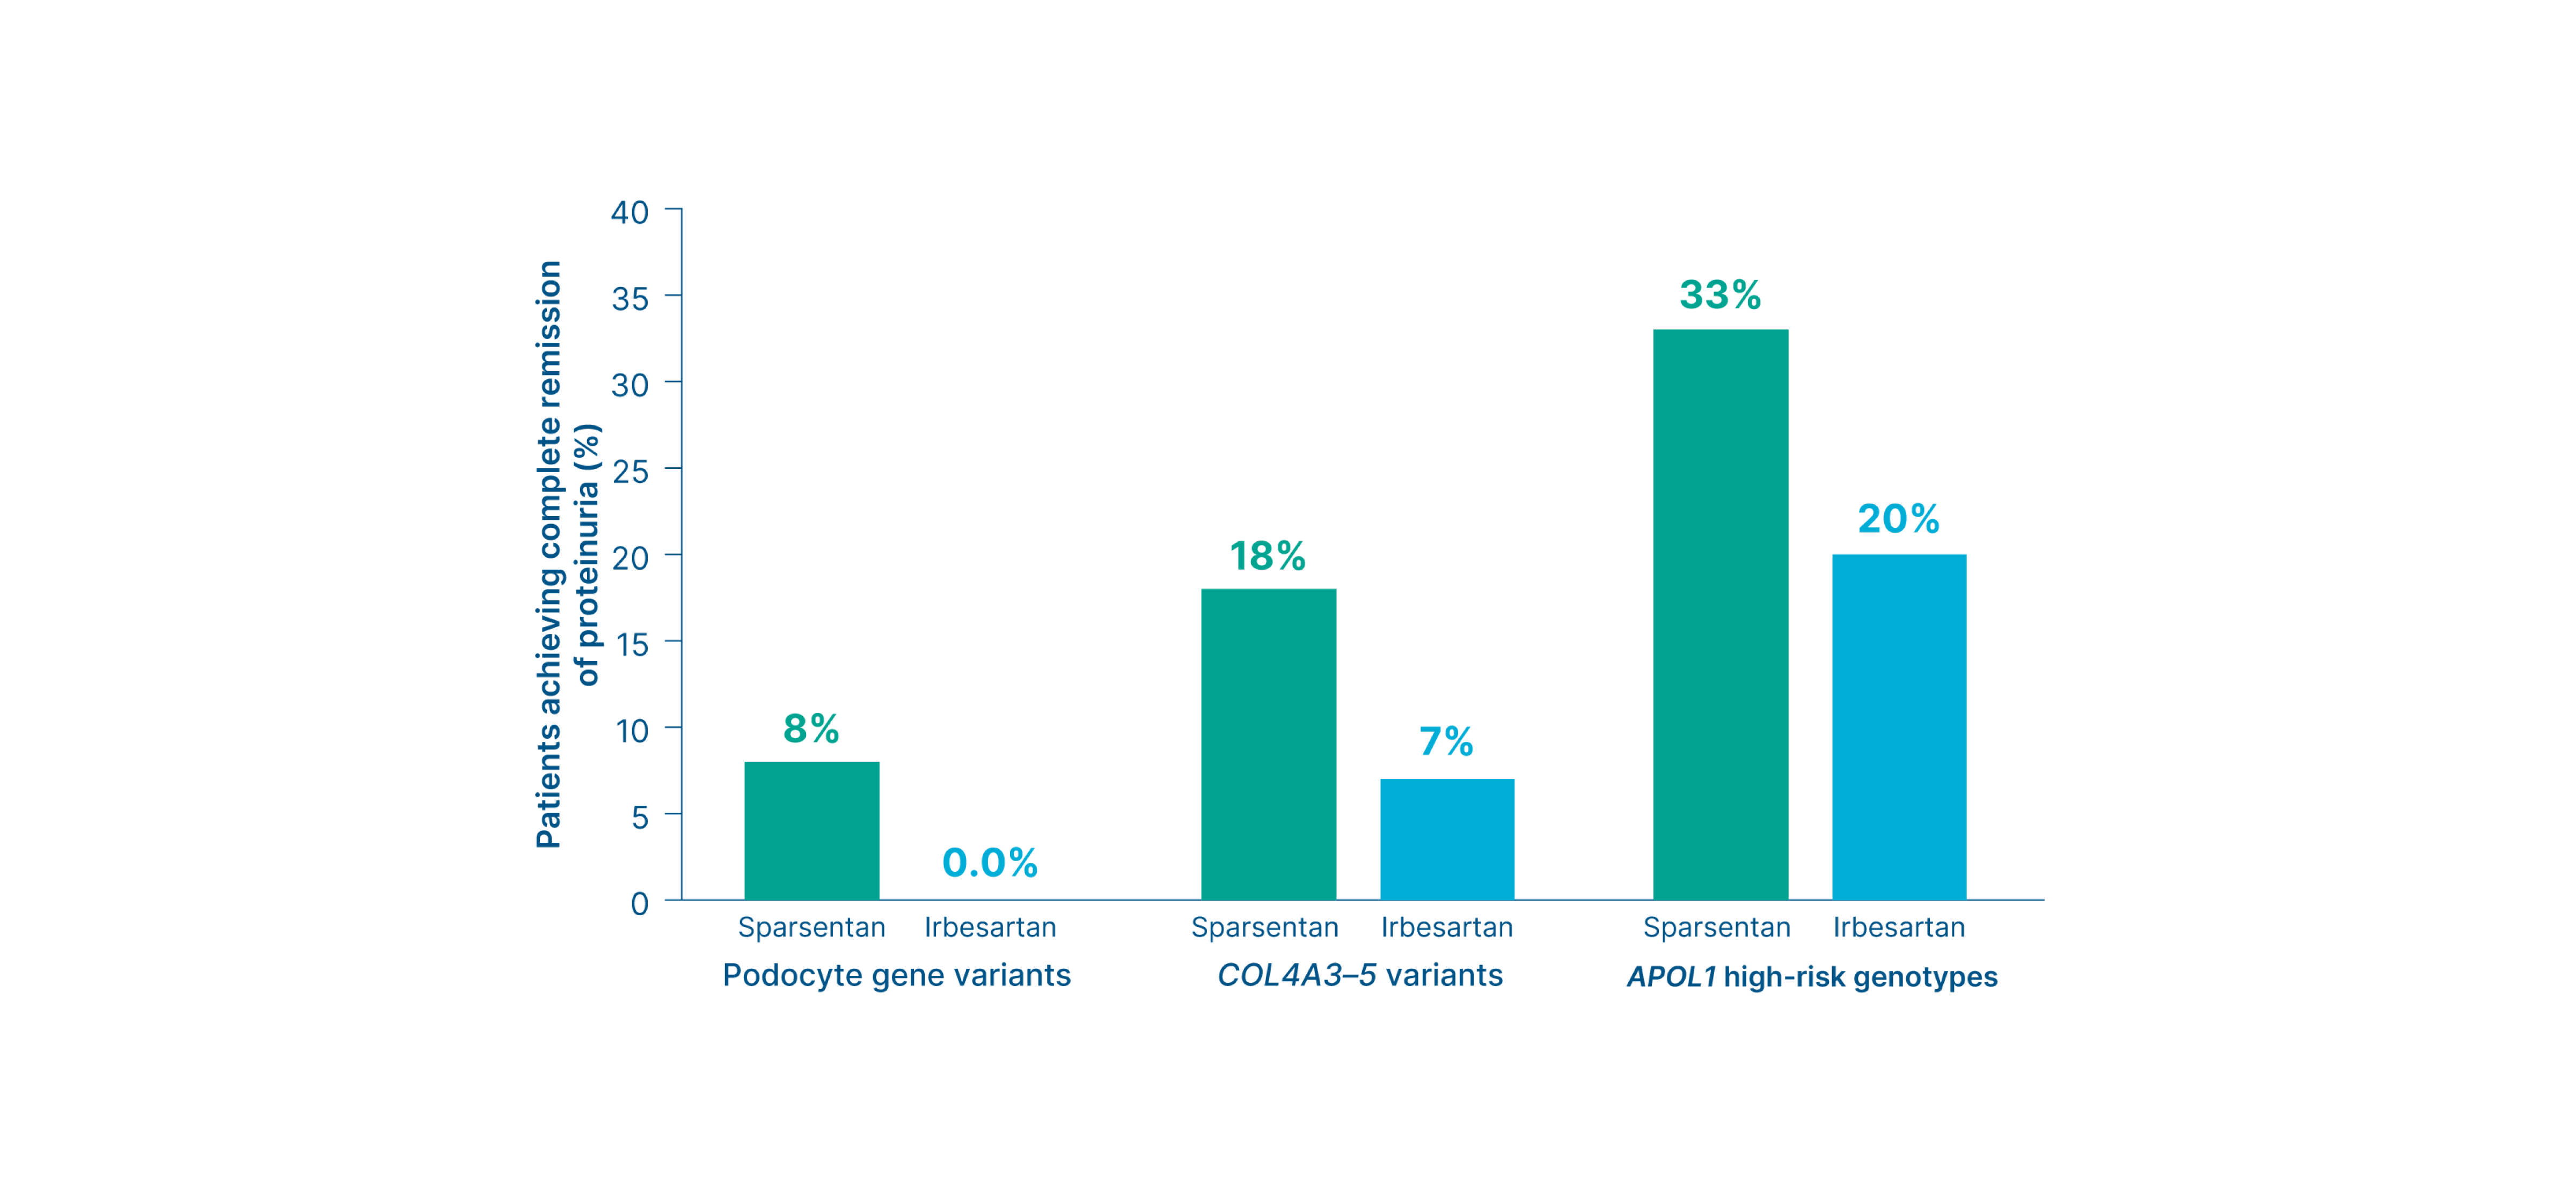
Summary
Sparsentan led to a numerically higher rate of complete remission of proteinuria vs. irbesartan across all genetic subgroups 9
Kidney function (eGFR)
Genetic-associated FSGS subgroup analysis
Changes in eGFR by genetic and treatment groups 9
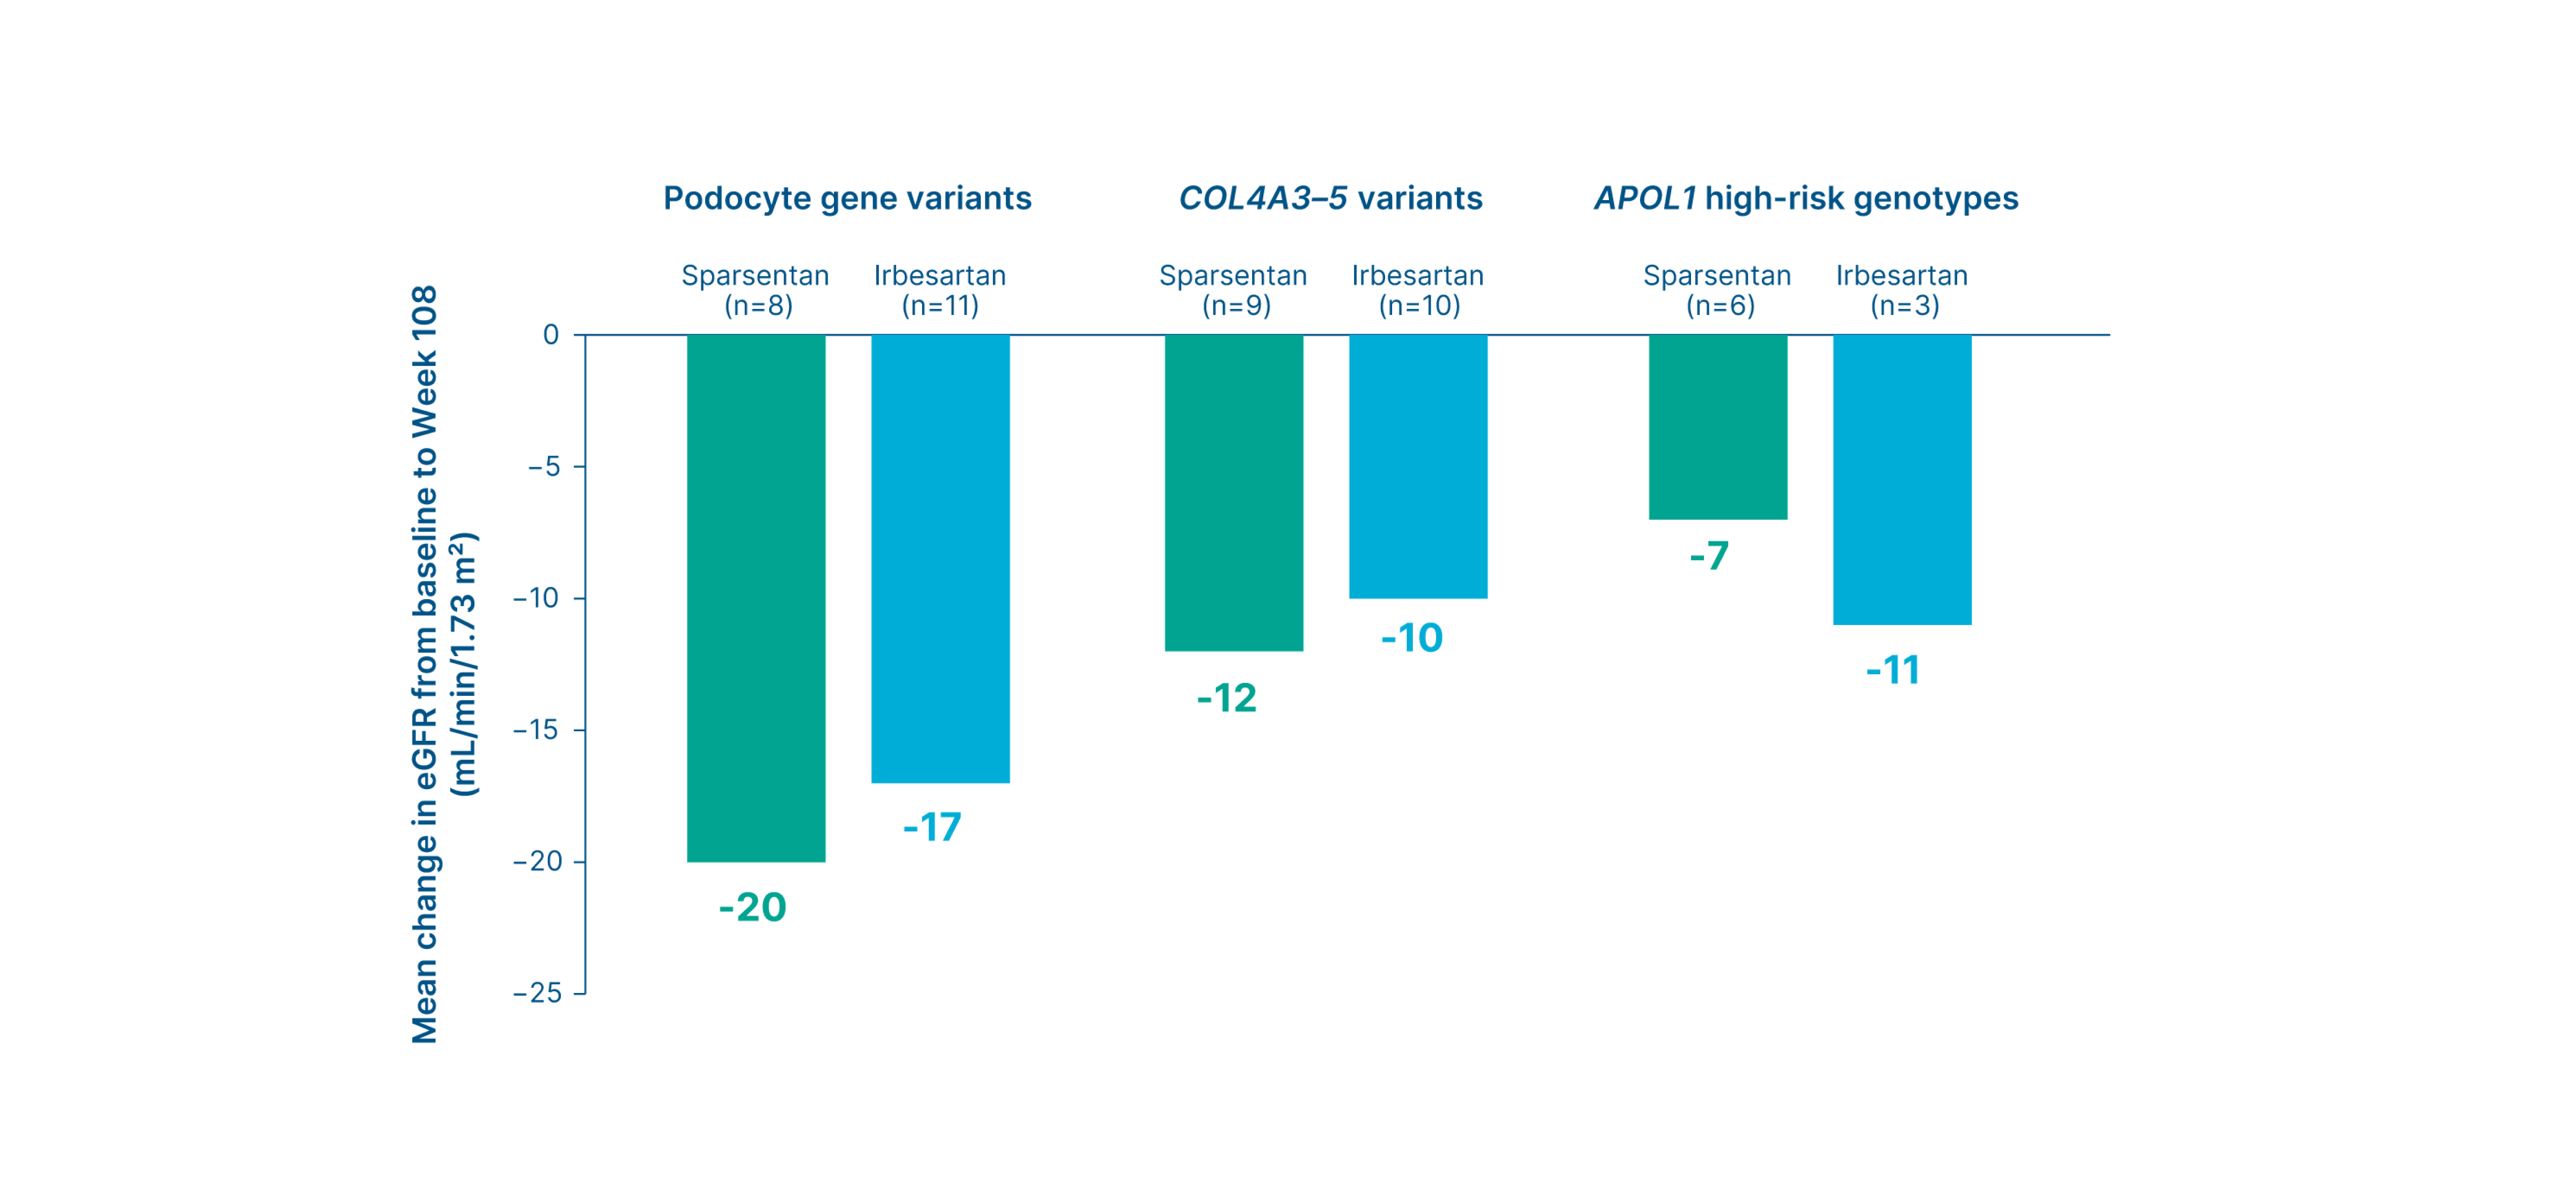
Summary
- Changes in eGFR from baseline to Week 108 showed no consistent treatment-related pattern within genetic subgroups 9
- However, patients with high-risk APOL1 genotypes had numerically less absolute eGFR decline with sparsentan than with irbesartan 9
Composite kidney failure endpoint at Week 108
Genetic-associated FSGS subgroup analysis
Proportion of patients who reached the composite kidney failure endpoint 9
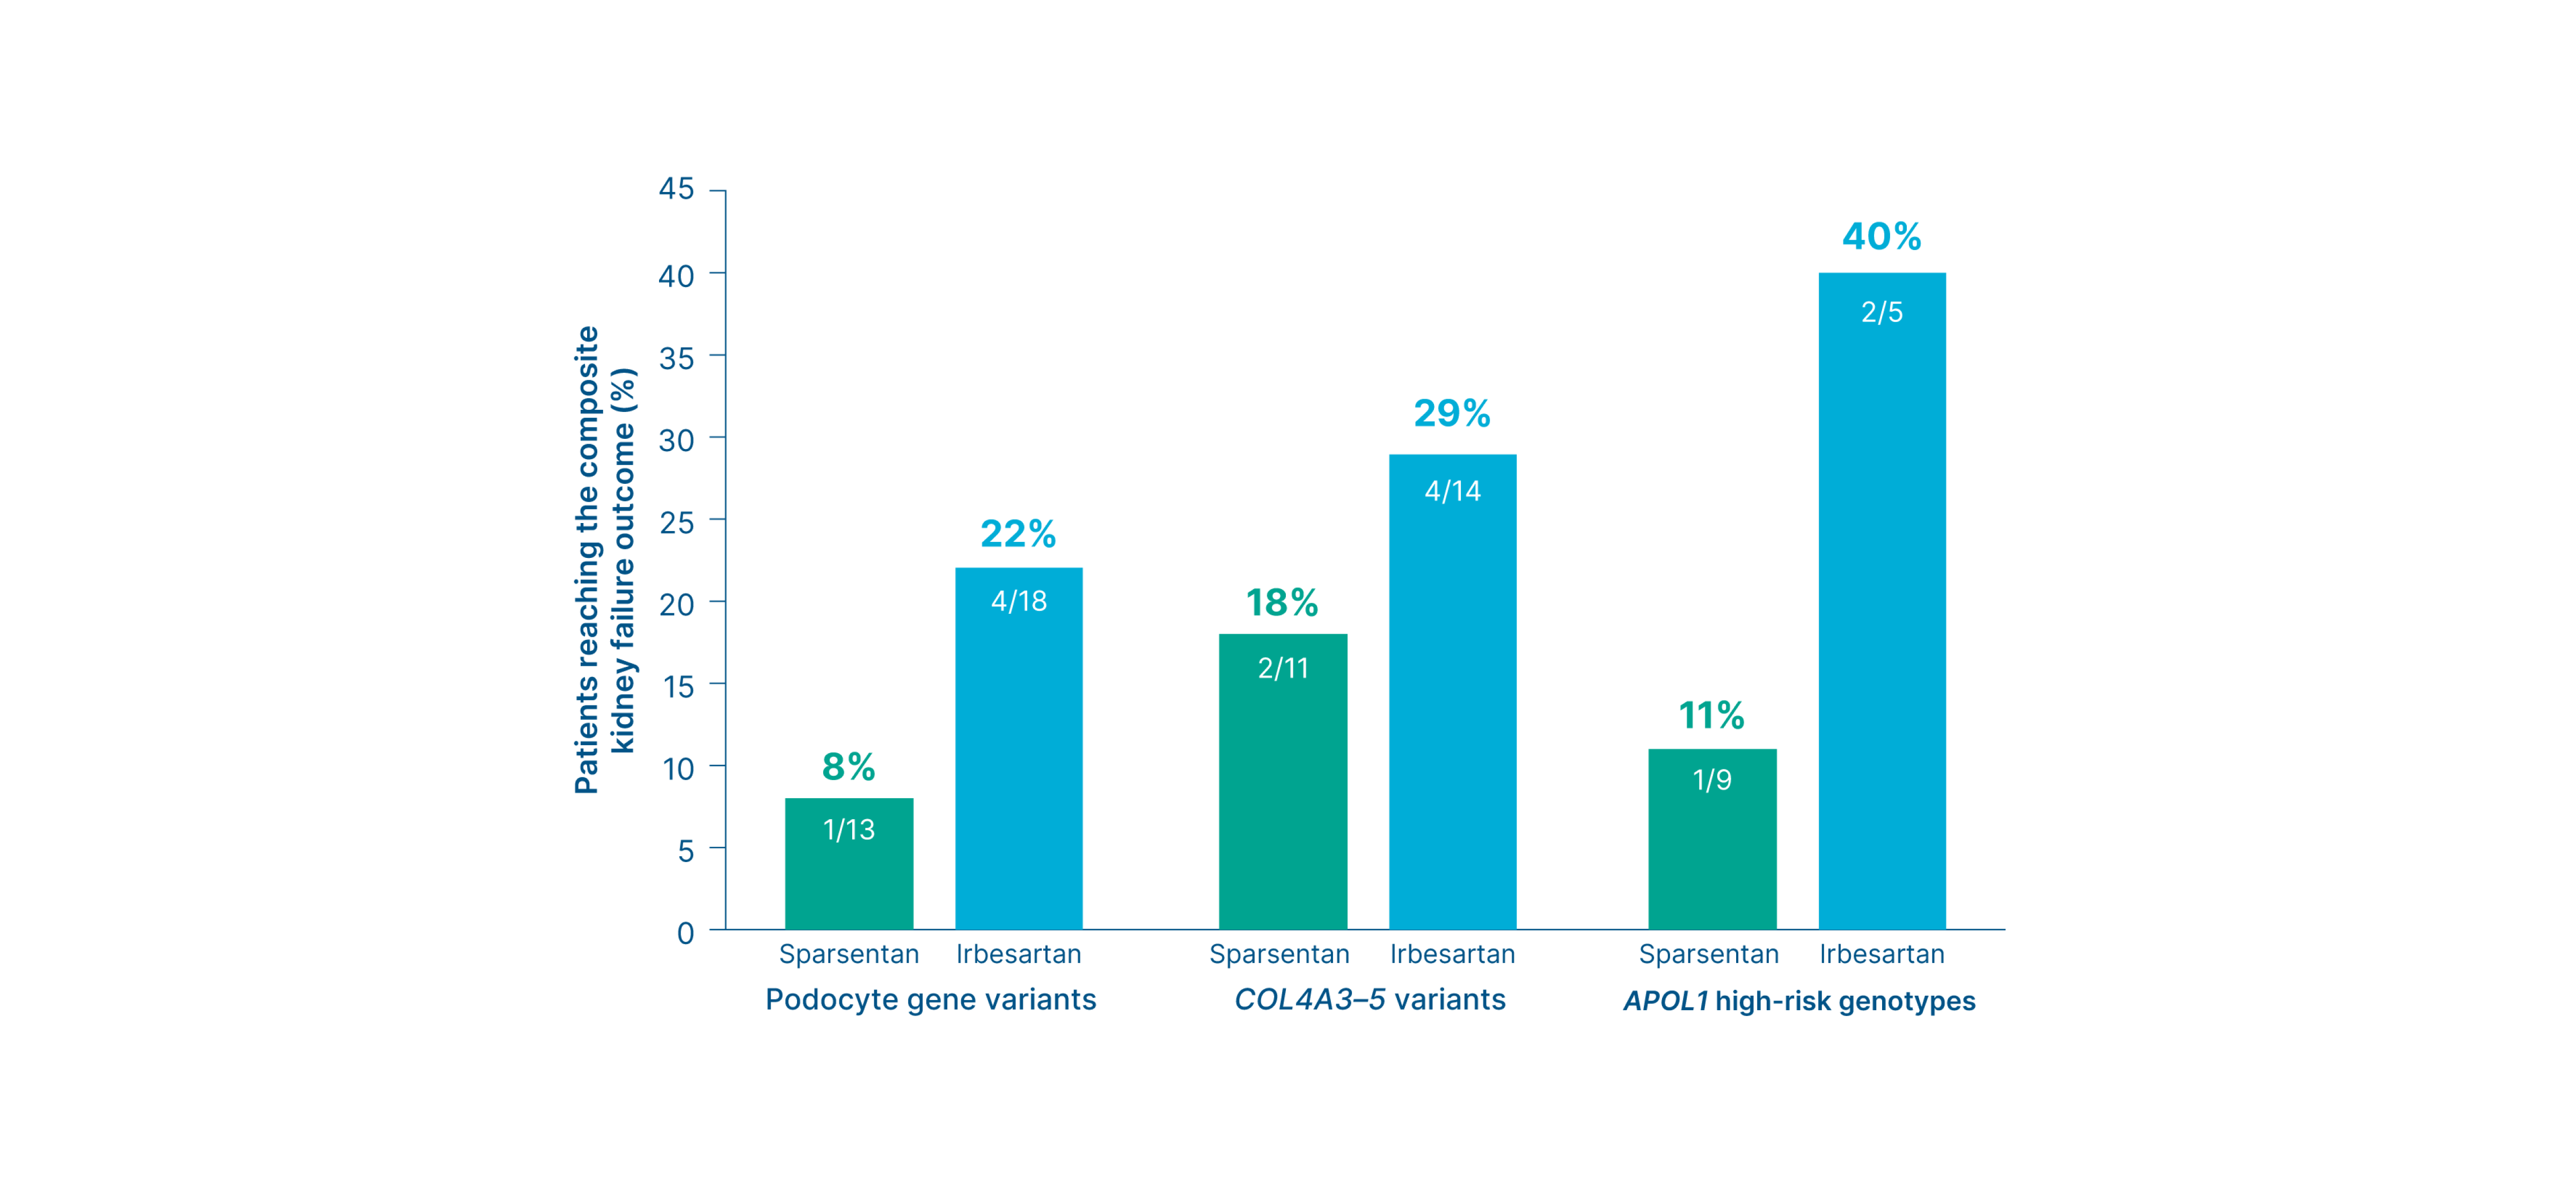
Summary
-
Across the three subgroups, the composite kidney outcome* occurred numerically less frequently in patients treated with sparsentan vs. irbesartan
9
- Podocyte gene variants (sparsentan vs. irbesartan): 8% vs. 22% 9
- COL4A3-5 variants (sparsentan vs. irbesartan): 18% vs. 29% 9
- APOL1 variants (sparsentan vs. irbesartan): 11% vs. 40% 9
Footnotes
*Defined as a 40% reduction in eGFR, progression to end-stage kidney disease, or death.9
-
Overall population
-
FSGS partial remission endpoint at Week 36: Surrogate efficacy endpoint
-
FSGS partial remission endpoint at Week 108: Prespecified exploratory endpoint
-
Proteinuria thresholds <0.3, <0.7, and <1.5 g/g -2: Exploratory endpoint
-
Proteinuria (UPCR) at Week 108: Prespecified exploratory endpoint
-
Time to complete remission of proteinuria: Exploratory endpoint
-
Time to UPCR <0.7 g/g: Post-hoc exploratory endpoint
-
Time to the FSGS partial remission endpoint: Exploratory endpoint
-
Estimated eGFR chronic slope or total slope: Primary/Secondary efficacy endpoint (varies by region)*
-
Kidney function (eGFR) at Week 112: Key secondary endpoint
-
Composite kidney failure endpoint at Week 108: Exploratory endpoint
-
Risk of kidney failure: Post hoc exploratory efficacy endpoint
-
-
Without nephrotic syndrome subgroup
-
Proteinuria (UPCR) at Week 108: Without nephrotic syndrome subgroup analysis*
-
Proteinuria thresholds <0.3, <0.7, and <1.5 g/g: Without nephrotic syndrome subgroup analysis*
-
Estimated eGFR chronic slope or total slope: Without nephrotic syndrome subgroup analysis*
-
Kidney function (eGFR) at Week 108: Without nephrotic syndrome subgroup analysis*
-
Kidney failure outcome: Without nephrotic syndrome subgroup analysis*
-
-
Pediatric subgroup
-
Proteinuria (UPCR) at Week 108: Pediatric subgroup analysis
-
Proteinuria thresholds <0.3, <0.5, and <1.0 g/g and FSGS partial remission endpoint: Pediatric subgroup analysis
-
Composite kidney failure endpoint at Week 108: Pediatric subgroup analysis
-
-
Genetic-associated FSGS subgroup
-
Proteinuria (UPCR) at Week 108: Genetic-associated FSGS subgroup analysis - Podocyte gene variants
-
Proteinuria (UPCR) at Week 108: Genetic-associated FSGS subgroup analysis - COL4A3-5 variants
-
Proteinuria (UPCR) at Week 108: Genetic-associated FSGS subgroup analysis - APOL1 high-risk genotypes
-
Time-weighted proteinuria (UPCR) at Week 108: Genetic-associated FSGS subgroup analysis
-
Complete remission of proteinuria: Genetic-associated FSGS subgroup analysis
-
Kidney function (eGFR): Genetic-associated FSGS subgroup analysis
-
Composite kidney failure endpoint at Week 108: Genetic-associated FSGS subgroup analysis
-
Over 108 weeks of treatment, TEAEs were reported with similar frequency in the sparsentan (n=172/184; 93.5%) and irbesartan (n=174/187; 93%) treatment groups 3
Adverse events reported in ≥2% of patients on sparsentan
Sparsentan (n=184)
Irbesartan (n=187)

Peripheral
edema
4*
42 (23%)
45 (24%)

Hypotension 4†
38 (21%)
25 (13%)

Hyperkalemia 4*
37 (20%)
21 (11%)

Dizziness 4*
25 (14%)
21 (11%)

Anemia 4
24 (13%)
10 (5%)

Acute kidney injury 4
8 (4%)
13 (7%)

Transaminase elevations 4‡
7 (4%)
5 (3%)
In the sparsentan group,
there were NO
3
:

Instances of heart failure classified as AEs 3

Cases of drug-induced liver injury 3

Clinically meaningful concerns regarding fluid retention or edema 3
Footnotes:
*Includes related terms. 4 † Including orthostatic hypotension. 4 ‡ Elevations in ALT or AST greater than 3-fold ULN. 4
TEAEs in the overall population 3, 10
Data are given as n (%).
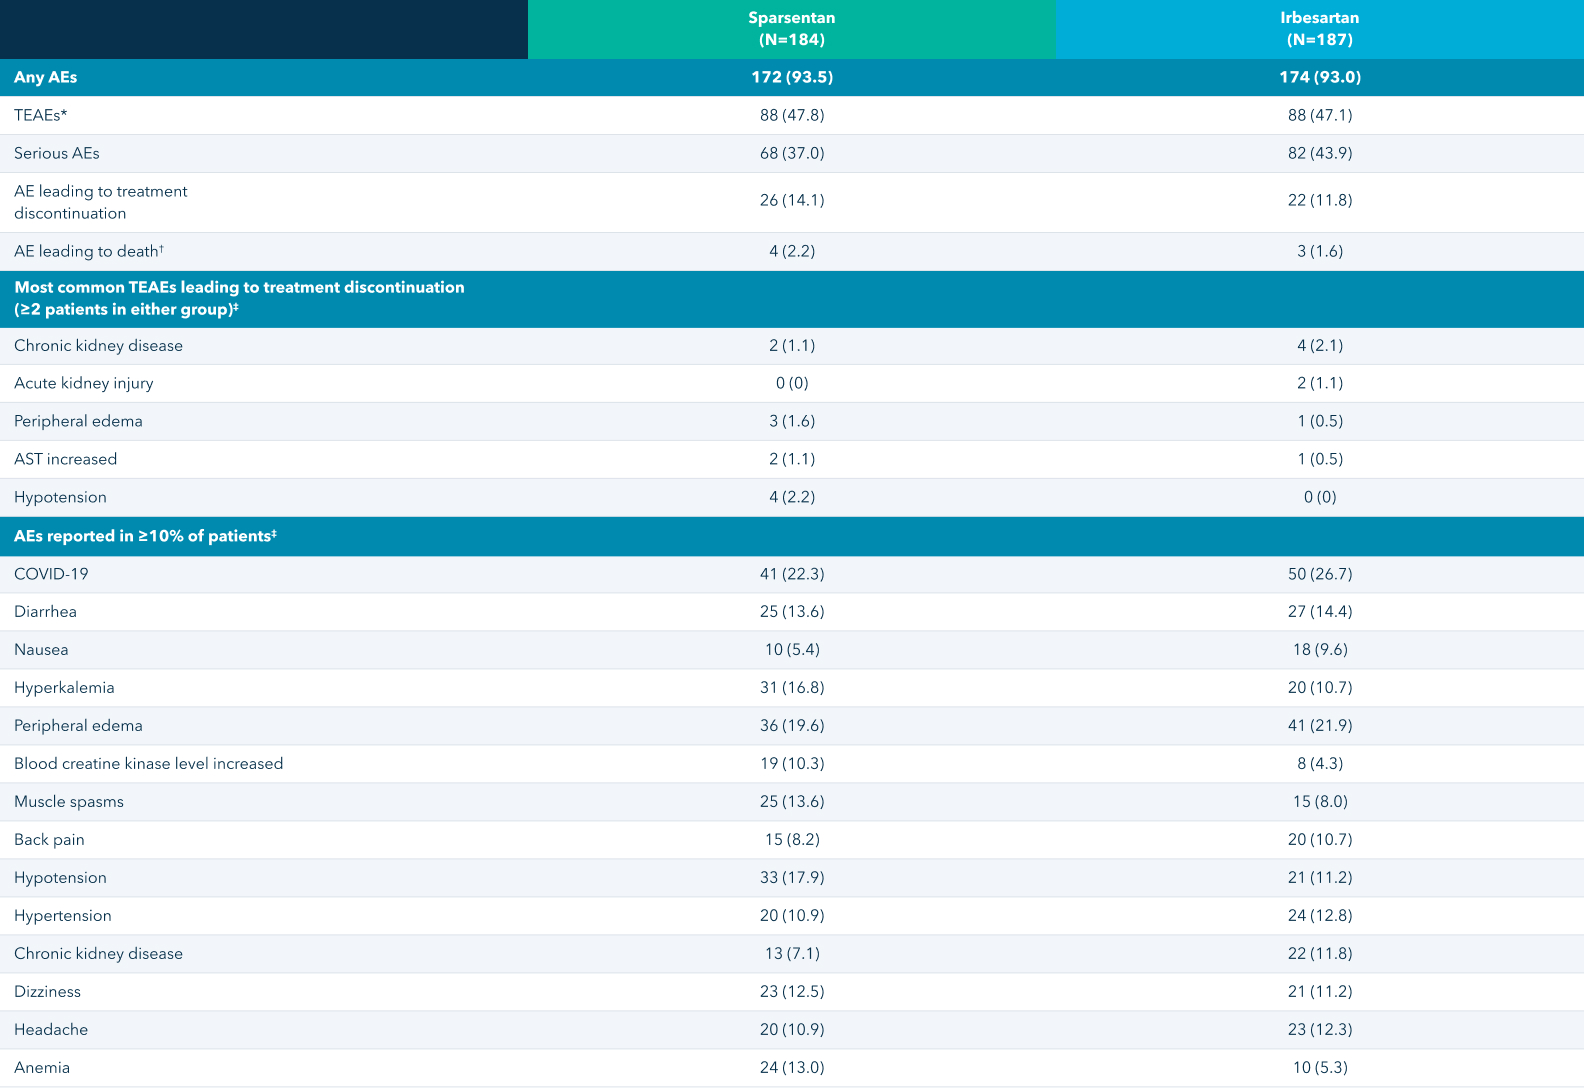
*TEAEs were defined as events that were considered to be "related" or "possibly related" to the trial drug by the investigator. Events with missing relationship information were counted as treatment-related events.
3
†AEs that led to death included neuroendocrine carcinoma, subdural hematoma, COVID-19, and suicide (in 1 patient each) in the sparsentan group; and COVID-19 pneumonia, COVID-19, and respiratory distress (in 1 patient each) in the irbesartan group.
3
‡If a patient had more than one event with a given preferred term, the patient was counted only once for that term.
3,
10
TEAEs in the pediatric subgroup 8*
Data are given as n (%).
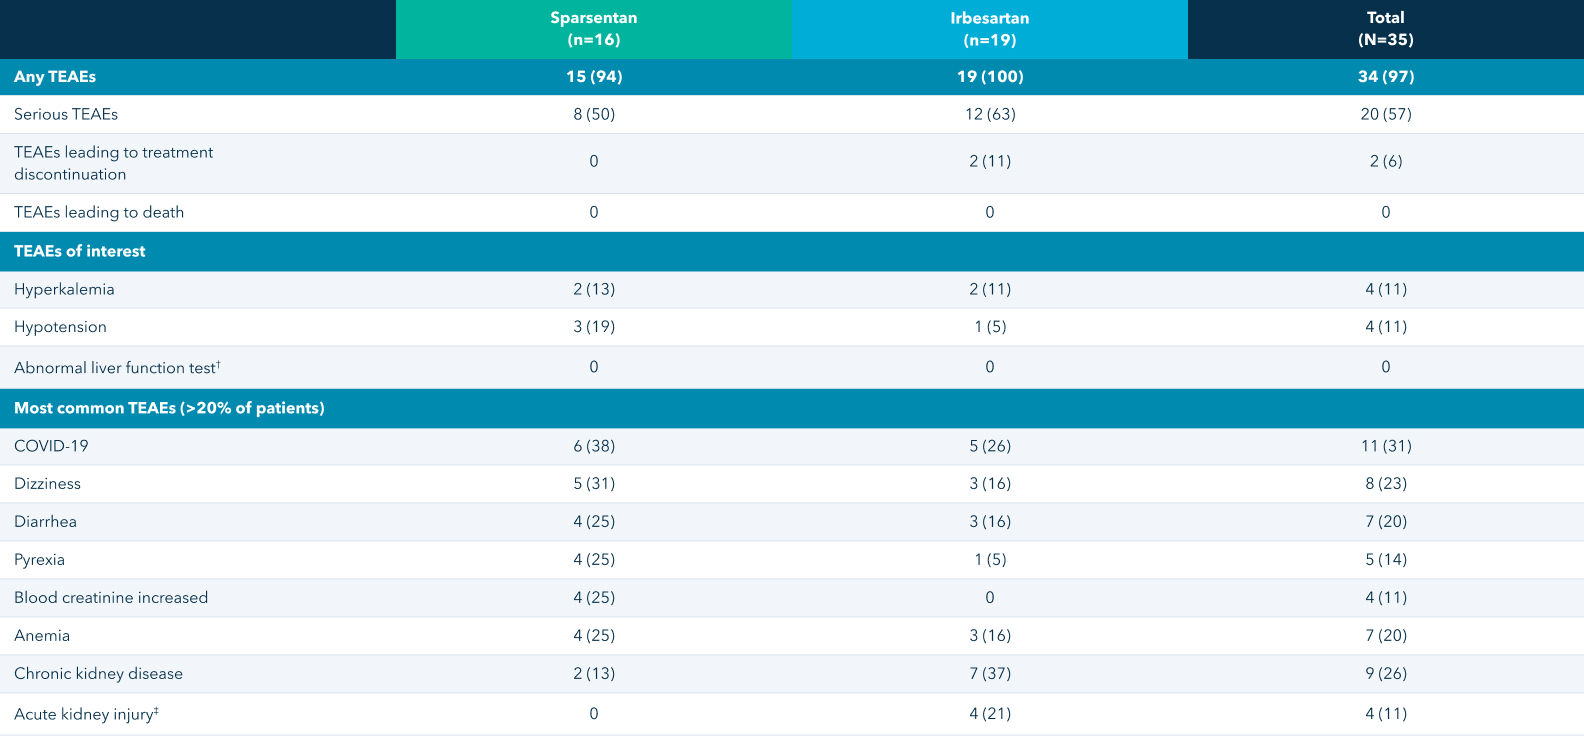
*All adverse events were coded per the Medical Dictionary for Regulatory Activities version 23.0.
8
†New elevation in ALT or AST >3× ULN (with or without elevation of total serum bilirubin to >2× ULN) or 2× increase from baseline in ALT or AST in a patient who had elevated values prior to starting study medication.
8
‡Increased serum creatinine of ≥0.3 mg/dL within 48 hours, increased serum creatinine of ≥1.5× baseline that is known or presumed to have occurred within the prior 7 days, or urine volume <0.5 mL/kg/hour for ≥6 hours.
8
Sparsentan overview

Sparsentan is a novel, non-immunosuppressive, single-molecule,
Dual Endothelin Angiotensin Receptor Antagonist (DEARA)
16,
17